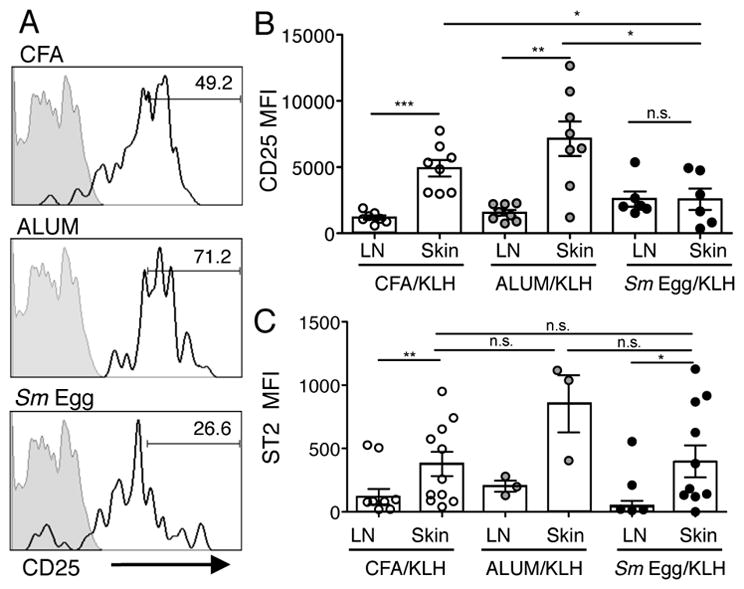
FIGURE 8.

Inflammation drives CD25 expression on skin Tregs. (A) CD25 expression on adoptively transferred DO11.10+ Tregs in the skin d7 post-immunization with KLH and CFA, Alum or Sm Egg. Grey filled histogram, FMO; solid line, CD25 expression; numbers, % of cells in CD25hi gate. (B) CD25 MFI on all DO11.10+ Tregs in skin and LN on d7. (C) ST2 MFI on DO11.10+ Tregs in the skin and LN on d7. Data from 2 independent experiments, 3–5 mice per group. Statistics by Paired T Test between LN and Skin, statistics between groups by Mann-Whitney.
