
Figure 1.
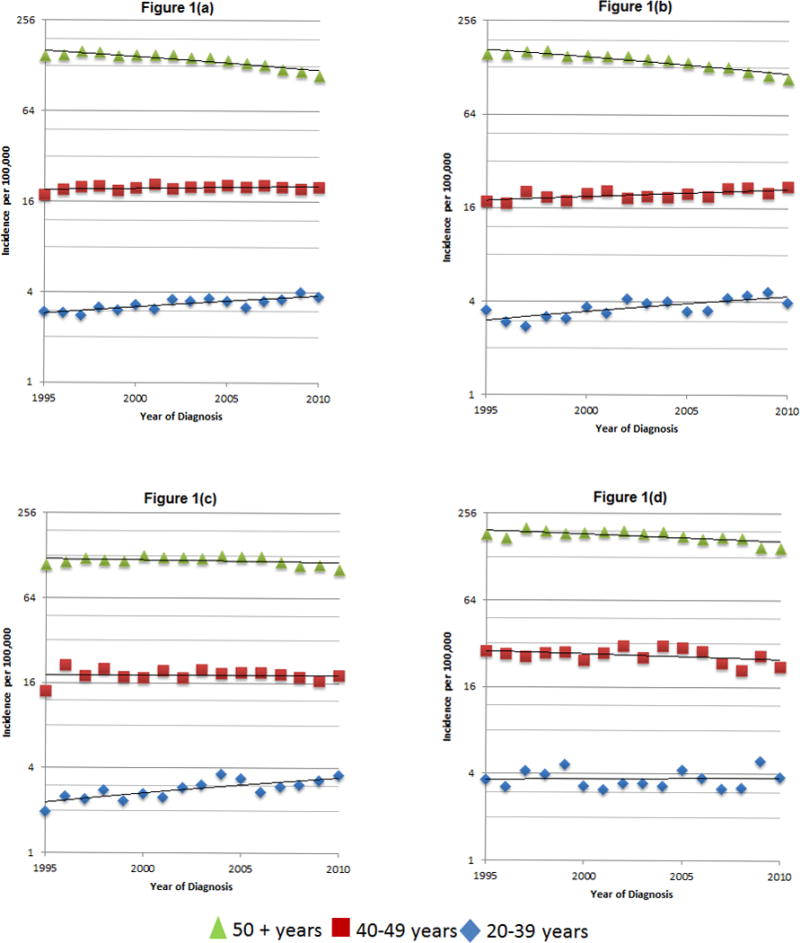
Time trends of age-adjusted CRC incidence rates, overall (a) and by race/ethnicity (b, non-Hispanic white; c, Hispanic; d, African American), Texas, 1995–2010
Official websites use .gov
A
.gov website belongs to an official
government organization in the United States.
Secure .gov websites use HTTPS
A lock (
) or https:// means you've safely
connected to the .gov website. Share sensitive
information only on official, secure websites.
Time trends of age-adjusted CRC incidence rates, overall (a) and by race/ethnicity (b, non-Hispanic white; c, Hispanic; d, African American), Texas, 1995–2010