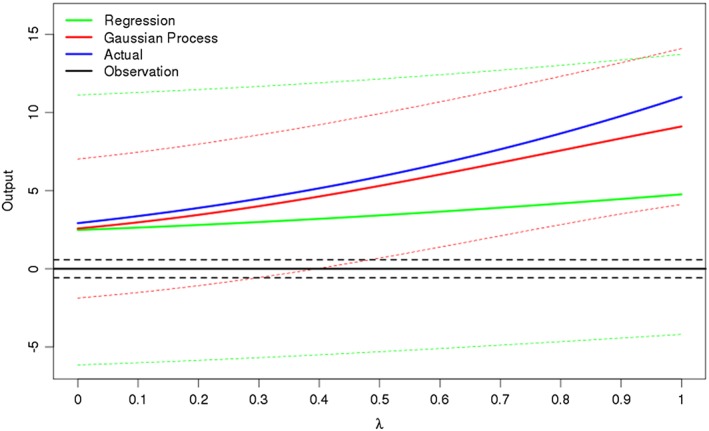
Figure 1.

How the prediction and 99% uncertainty bounds change for a regression‐only emulator (green) and a Gaussian process emulator (red) for a line between two design points x 1, x 2 in 10‐dimensional space, where λ describes how far along this line we are. The actual function (blue) is a toy model. The Gaussian process is a better approximation of the original function and has less uncertainty on its predictions here. The observation is taken to be 0, observed with an observation error given by the dotted black lines
