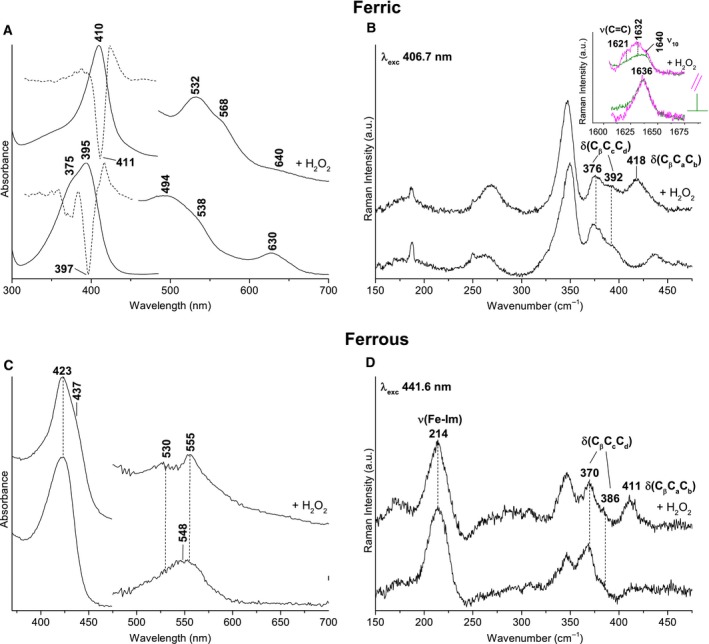
Figure 5.

UV‐vis and resonance Raman spectra of ferric and ferrous forms of coproheme‐LmHemQ and heme b‐LmHemQ in 50 mm phosphate buffer, pH 7.0. (A) UV‐vis and second derivative spectra of ferric coproheme‐LmHemQ and heme b‐HemQ. Heme b‐LmHemQ was formed by using a 5 : 1 stoichiometric excess of H2O2 to coproheme‐LmHemQ. (B) Resonance Raman spectra of ferric coproheme‐LmHemQ and heme b‐LmHemQ in the low frequency region showing the propionyl and vinyl bending modes. The inset shows the vinyl stretching modes region in polarized light. Experimental conditions: excitation wavelength 406.7 nm, laser power at the sample 5 mW; average of six spectra with 60‐min integration time (coproheme‐LmHemQ), average of four spectra with 40‐min integration time (heme b‐LmHemQ). (C) UV‐vis spectra of ferrous coproheme‐LmHemQ and heme b‐HemQ (D) Resonance Raman spectra of ferrous coproheme‐LmHemQ and heme b‐LmHemQ in the low frequency region showing the ν(Fe‐Im) stretching mode together with the propionyl and vinyl bending modes. Experimental conditions: excitation wavelength 441.6 nm, laser power at the sample 10 mW; average of six spectra (coproheme‐LmHemQ) and of three spectra (hemeb‐LmHemQ) with 30‐min integration time.
