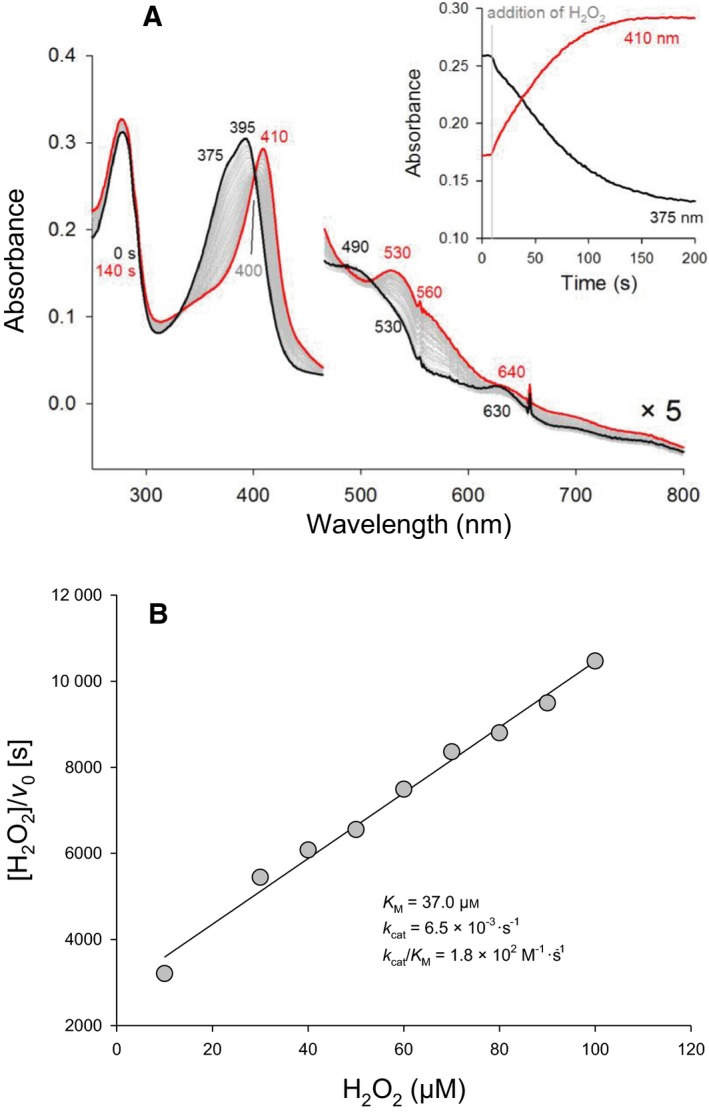
Figure 6.

Enzymatic activity of coproheme‐LmHemQ mediated by H2O2. (A) Spectral conversion of 5 μm coproheme‐LmHemQ mediated by addition of 50 μm H2O2. The initial coproheme‐LmHemQ spectrum is depicted in black, the resulting final heme b‐LmHemQ spectrum in red. Selected spectra during conversion are shown in gray. The inset depicts time traces, extracted at 370 and 410 nm. (B) Kinetics of the H2O2‐mediated conversion of coproheme‐LmHemQ in 50 mm phosphate buffer, pH 7.0, are presented as Hanes plot.
