Figure 7.

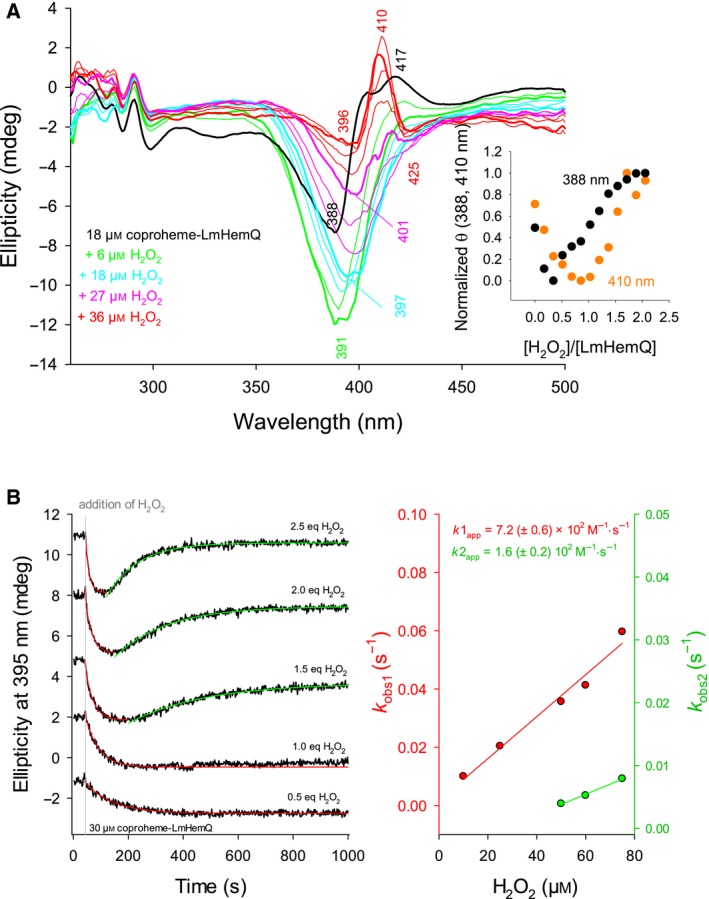
Reaction of H2O2‐mediated coproheme conversion to heme b followed by electronic circular dichroism. (A) Spectral conversion of 18 μm coproheme‐LmHemQ mediated by stepwise titration with H2O2 (0–36 μm). Spectrum of coproheme‐LmHemQ is depicted as bold black line (0 μm H2O2), final spectrum as bold red line (36 μm H2O2). Bold green line, bold cyan line, bold pink line represent addition of 6, 18, and 27 μm H2O2, respectively. Thin lines in the respective color are at H2O2 concentrations lower than the one represented by a bold line (green: 3 μm; cyan: 9 μm, 15 μm; pink: 21 μm, 24 μm; red: 30 μm, 33 μm H2O2). The inset depicts the normalized changes in ellipticity at 388 (black) and 410 nm (orange) after each titration step versus the H2O2/coproheme‐LmHemQ ratio. (B, left panel) Time traces (black lines) of conversion of 30 μm coproheme‐LmHemQ to heme b‐LmHemQ followed by the change of ellipticity at 395 nm. Single exponential fits are depicted in red (first phase) and green (second phase). The time of H2O2 addition is indicated as gray line, spectra were shifted for clarity. (B, right panel) Plots of k obs1 (red) and k obs2 (green) versus H2O2 concentration with linear fits. Conditions: 50 mm phosphate buffer, pH 7.0.
