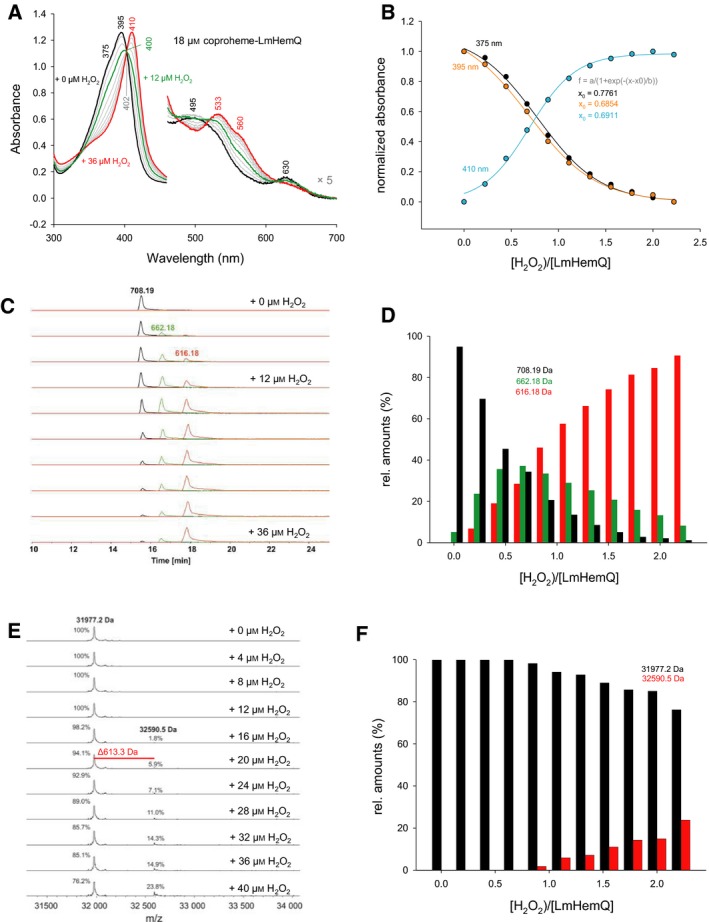
Figure 8.

Stoichiometry of the enzymatic activity of coproheme‐LmHemQ mediated by H2O2. (A) UV‐vis absorption spectra recorded following the stepwise titration of 18 μm coproheme‐LmHemQ with H2O2 (0–36 μm). (B) Plot of normalized absorbance changes at 375 (black), 395 (orange), and 410 nm (cyan) after each titration step versus the H2O2/coproheme‐LmHemQ ratio (including sigmoidal fits). (C) HPLC profiles and mass spectrometric analysis of samples from the titration experiment described in (A); coproheme (708.19 Da, black), monovinyl, monopropionate deuteroheme (662.18 Da, green), heme b (616.18 Da, red). (D) Relative amounts of the three porphyrin species (area under curve of HPLC profiles) at each H2O2/coproheme‐LmHemQ ratio. (E) Whole protein analyses of the samples from the titration experiment described in (A) and (C). (F) Relative amounts of LmHemQ without cross‐linked heme (black, 31 977.2 Da) and cross‐linked heme (red, 32 590.5) depending on the [H2O2]/coproheme‐HemQ ratio. Conditions: 50 mm phosphate buffer, pH 7.0.
