
Figure 4.
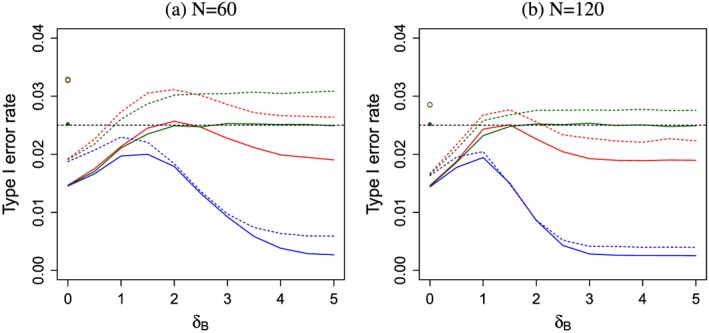
The FWER as function of δ B if δ A=0 for the separate (green), simultaneous (blue) and improved simultaneous (red) designs using z‐test O'Brien Fleming boundaries (dashed) or the nominal p‐value approach (solid) applied to t‐statistics. No futility bound is applied. 106 simulation runs for each scenario. The FWER under the global null hypothesis δ A=δ B=0 for the nominal p‐value approach (z‐test) represented by the full (empty) dot is the same for all three designs. The dashed horizontal line denotes nominal level α = 0.025. Left graph for maximum total sample size N = 60, right graph N = 120.