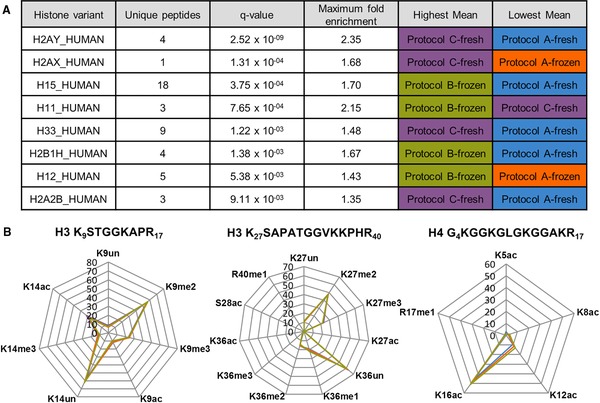
Figure 4.

Label‐free quantification of histone variants and hPTMs. (A) Table depicting significantly different extracted histone variants (q‐value < 0.01) between the four protocols. Note that H2AX_HUMAN was only quantified by one unique peptide. (B) Radar charts representing the average RA of targeted hPTMs on two H3 peptides and one H4 peptide. Each targeted hPTM is located on one angle of the radar chart and each protocol is represented by a different color A‐fresh (blue), C‐fresh (purple), A‐frozen (orange), B‐frozen (green) whereby a RA of 0 is located in the center, ascending outwards. RAs and their SDs can be consulted in Supporting Information Table 2. K, lysine; R, arginine; S, serine; un, unmodified; me1, monomethylation; me2, dimethylation; me3, trimethylation; ac, acetylation; ph, phosphorylation
