
Figure 1.
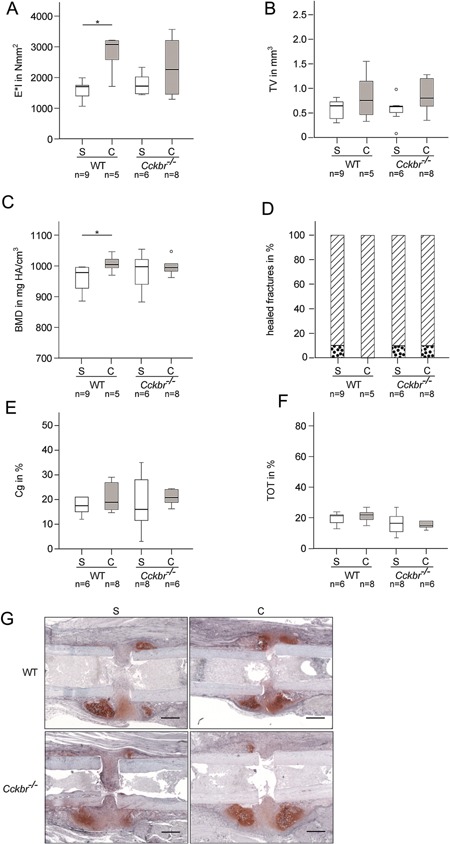
(A) Flexural rigidity of the fractured femora at day 32 of wildtype (WT) and Cckbr−/− mice fed with standard died (S) or supplemented with calcium (C). (B) Total callus volume (TV) and (C) bone mineral density (BMD) of the fracture callus at day 32. (D) Percentage of nonhealed (dotted bar) and healed fractures (hatched bar) per group. Healed fractures were defined as ≥3 bridged cortices. (E) Percentage of osseous tissue (TOT) and (F) cartilaginous tissue (Cg) in the fracture callus after 10 days. *vs. S, p ≤ 0.05. The sample size for each experiment is indicated below each group. (G) Representative images of the fracture callus at day 10 of WT and Cckbr−/− mice fed with standard died (S) or supplemented with calcium (C). Slices were stained with Safranin O to identify cartilage (red), bone (light blue), and fibrous tissue (purple). Scale bar: 500 μm.