Figure 3.
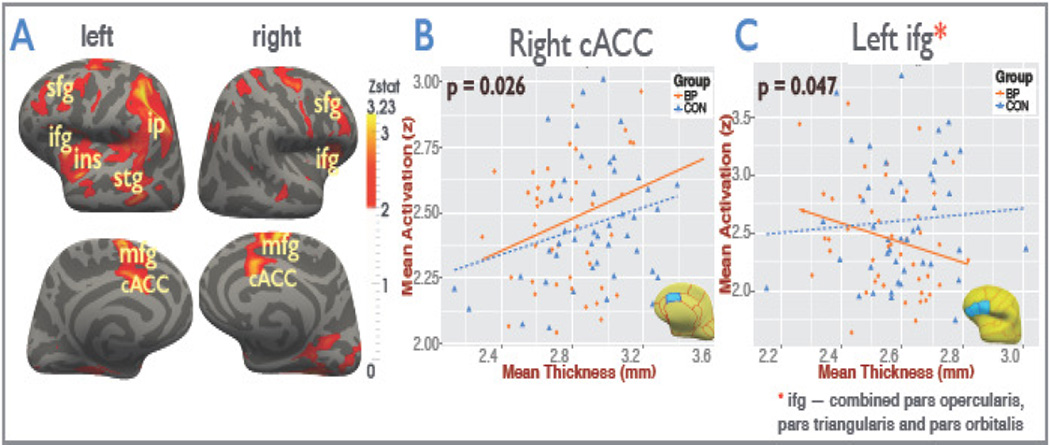
(A) Functional hypoactivation (Z-score) in bipolar patients compared to controls visualized on the inflated Freesurfer atlas. Significant clusters of reduced activation show the inferior frontal gyrus (ifg), superior frontal gyrus (sfg), medial frontal gyrus (mfg), insula (ins), caudal anterior cingulate gyrus (cACC), superior temporal gyrus (stg), and inferior parietal (ip) regions. (B) Partial correlations between mean BOLD activation and a priori mean region-of-interest (ROI) cortical thickness in the right caudal anterior cingulate (cACC), controlling for age, are displayed separately for bipolar (BP) patients and controls (CON). Only patients demonstrated a significant correlation (r = 0.33, p = 0.026) between thickness and functional activation. (C) Significant disease interaction effect (p=0.047) was found for the functional activation and cortical thickness in the left inferior frontal gyrus which consists of the caudal middle frontal, lateral orbitofrontal, medial orbitofrontal, pars orbitalis, pars triangularis, pars opercularis, rostral middle frontal, superior frontal, and the frontal pole ROIs merged together. It was also observed that the left frontal lobe mean activations were significantly negatively correlated (r = −0.34, p = 0.021) with the respective mean cortical thickness in patients when controlled for age and the duration of the euthymic period but not in controls.

