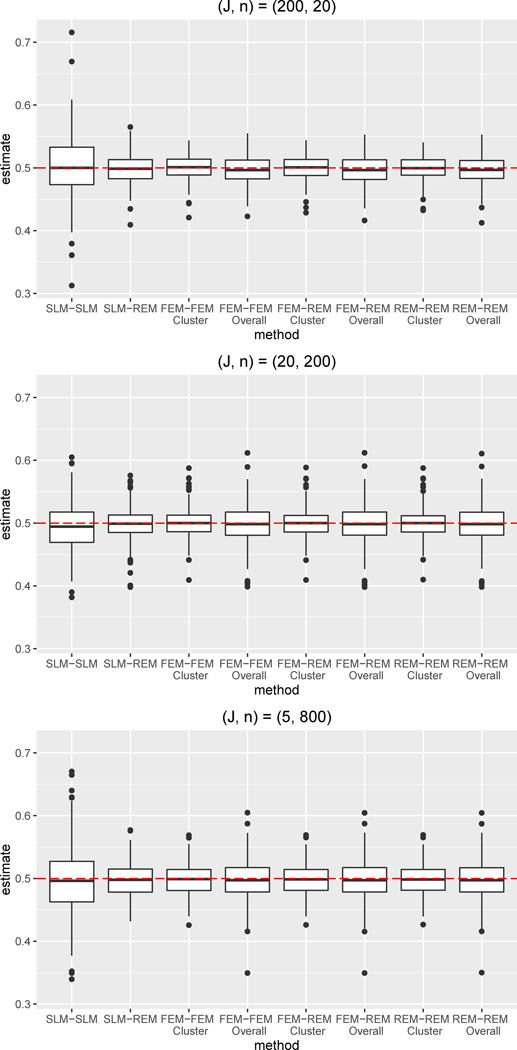
Figure 1.
Boxplots of bias for the ATE estimate for simulation condition with no differential confounding and W included in both the propensity score and outcome regression (i.e., both regressions correctly specified).
Abbreviations: SLM = single level model, FEM = fixed effects model, REM = random effects model

