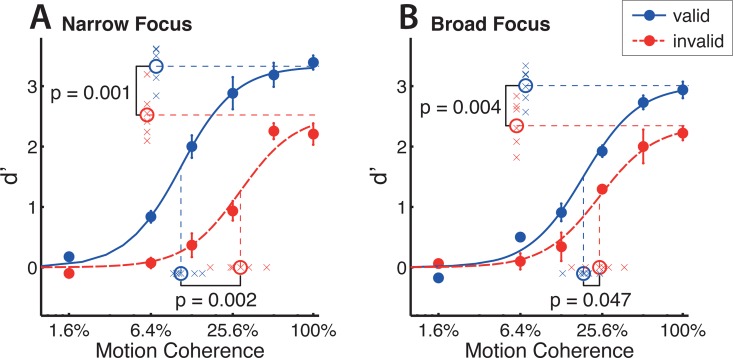
Fig 4. A narrow focus of attention causes coherence gain, while a broad focus does not.
Fits indicate coherence response functions for pooled performance across 6 subjects. Data points are the mean discrimination performance across subjects for each tested attentional condition, cue validity and coherence level. Panel A corresponds to the narrow focus cue type (single headed arrow) and panel B to the broad focus cue type (three headed arrow). Performance (broad and narrow conditions) was fitted with four dependent Naka-Rushton equations, sharing a jointly optimized slope. Significance values indicate differences in Naka-Rushton fit coefficients of per-subject fits (see also Fig 5). When comparing invalidly and validly cued trials, increases in the asymptotic performance at high levels of coherence indicate response gain effects, while decreases in coherence level at half maximum indicate coherence gain effects. Error bars of data points indicate plus/minus one standard error, crosses around coefficient indicators represent individual coefficients obtained from per-subject fittings of the coherence response function.

