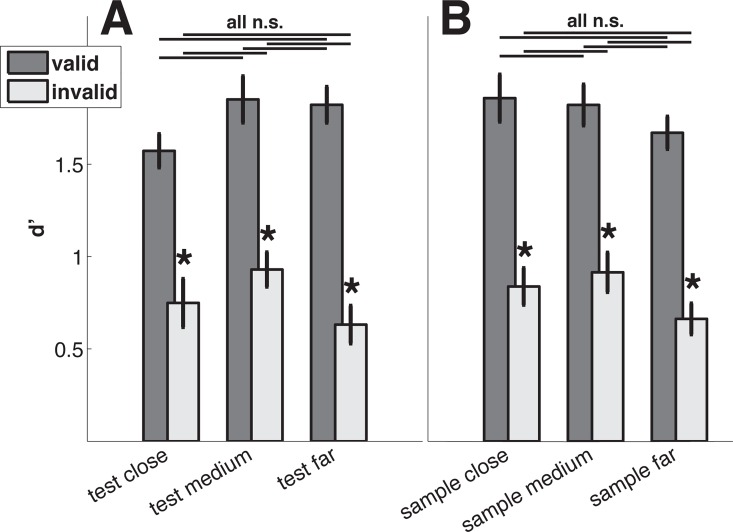
Fig 6. Task performance across coherences.
(A) Performance for groups of trials that differ in how far off the cued direction the test direction occurred. The possible range of test-cue differences was divided in three evenly spaced groups (close, medium, far). Lines above bars represent pairwise comparisons and stars indicate significant differences of adjacent bars. Error bars indicate plus/minus one standard error. (B) Like A, but groups were defined based on the differences between cue and sample.

