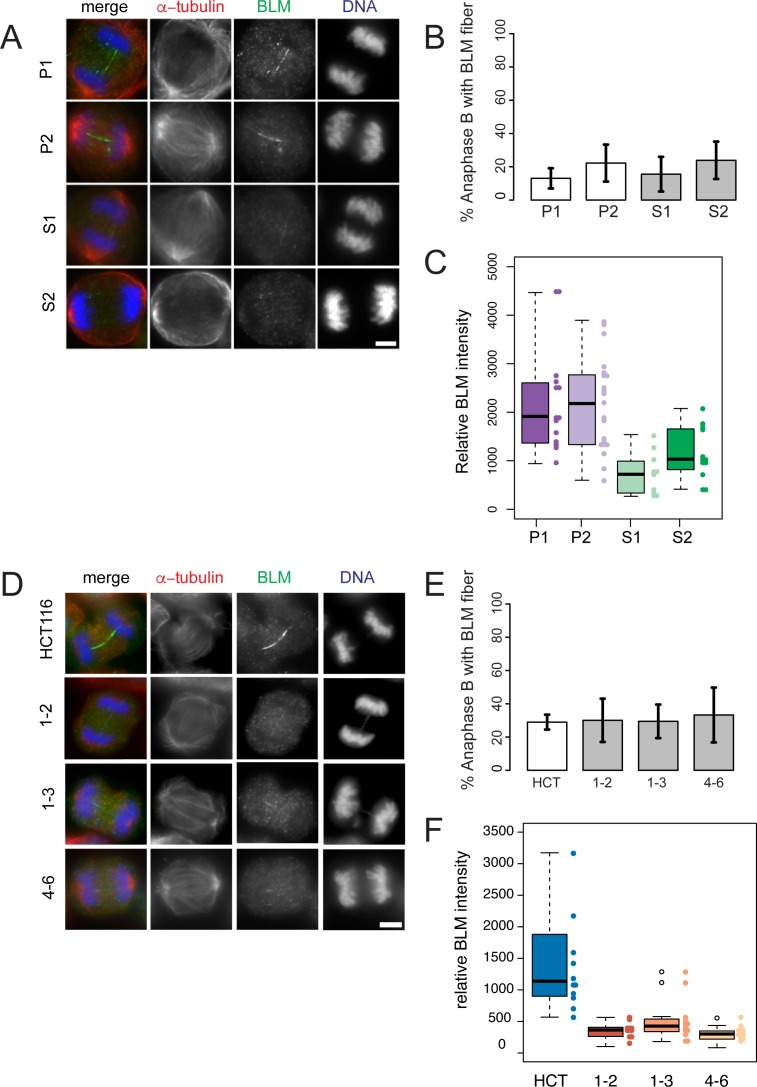
Fig 6. BLM fibers are weaker in anaphase B cells lacking RMI2.
Representative anaphase B images of parental heterozygous, P1 and P2, and homozygous siblings S1 and S2, fibroblasts (A) and RMI2 wild-type and null HCT-116 cells (D) stained with anti-BLM (green), anti-α-tubulin (red) and DAPI for DNA (blue). Scale bar 5 μm. For anaphase A analysis see S8 Fig. Quantification of BLM-staining fibers in anaphase B cells in (B) parent (P1, P2) and sibling (S1, S2), and (E) wild-type HCT-116 control and RIM2 null cells (1–2, 1–3, 4–6). Data taken from three independent experiments, with a minimum of 15 anaphase B cells scored for each fibroblast cell line (P1, P2, S1, S2) per experiment and also for each HCT-116 cell line (wild type, 1–2, 1–3, 4–6) per experiment. Error bars represent standard error of the mean. Quantification of BLM fiber intensity on fibroblast cell line (P1, P2, S1, S2) (C) and wild-type HCT-116 and RIM2 null anaphase cells (F). Data for C, F pooled from anaphase A and B cells from two independent experiments.

