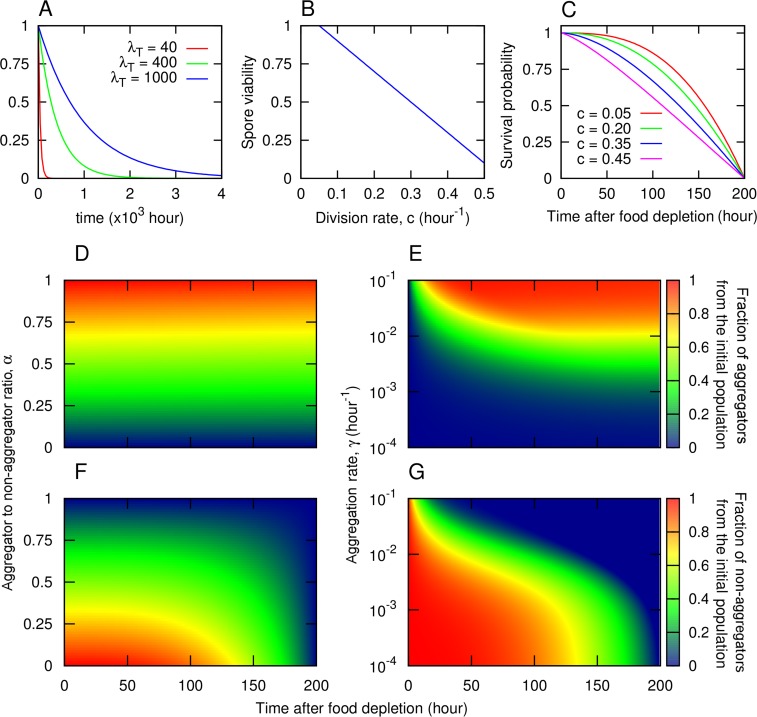
Fig 1. Framework assumptions.
A) After food consumption, the time until the arrival of a new pulse of nutrients is a stochastic variable that follows an exponential distribution of mean value λT (not normalized for clarity). B) Spore viability decreases linearly with division rate, which is assumed to correlate negatively with cell size. C) Survivorship curves for starving non-aggregated cells with different division rates, c. The curves show the probability of being alive at a time t after starvation, which correlates negatively with the division rate. For D)–G) we used the survival curve corresponding to c = 0.15. D, F) Discrete aggregation mechanism. Genotypes are determined by the fraction of the population, α, that aggregates. The rest, a fraction 1 – α, remains solitary. The population partitioning takes place instantaneously after food consumption. E, G) Continuous aggregation mechanism. Genotypes are determined by the rate at which cells aggregate, γ. The fraction of the population that aggregates depends both on the aggregation rate, γ, and on the length of the starvation period. D, E) Fraction of the population at the beginning of the starvation period that has turned into aggregators at time t after starvation. F, G) Fraction of the initial population that remains as solitary cells at time t after starvation. Aggregated cells also die at a very small rate, δ, but this effect is imperceptible at short times scales. Other parameters are specified in S1 Table.

