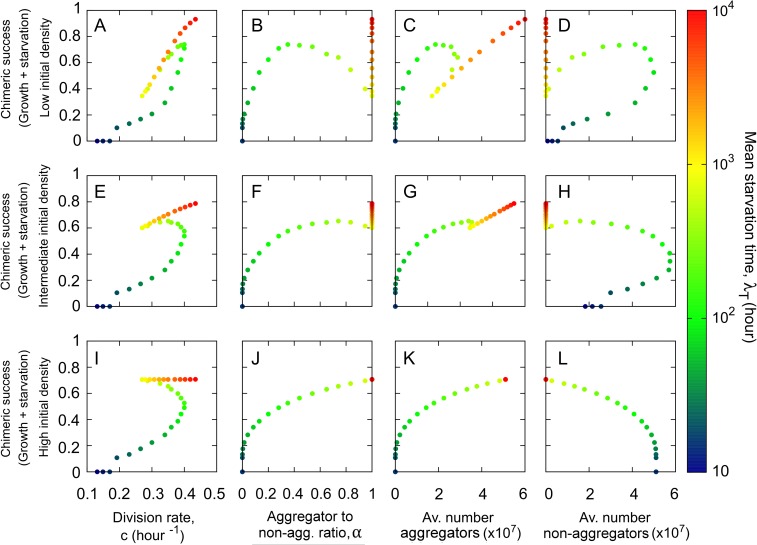
Fig 5. Correlations between overall chimeric success and non-social life history traits.
Each one of the 31 winning genotypes obtained in Fig 2B is mixed in pairs with the rest of the genotypes and the fraction of spores is counted following a growth phase and the subsequent starvation onset. The chimeric success is obtained as the mean value of this fraction of spores averaged over all the possible pair mixes as defined in Eq (5) of the main text. From left to right: chimeric success versus division rate (A, E, I), aggregator to non-aggregator ratio (B, F, J), average number of aggregators (C, G, K) and average number of non-aggregators (D, H, L). From top to bottom: low cell:resource initial density (103 cells and R0 = 108), intermediate cell:resource initial density (107 cells and R0 = 108) and high cell:resource initial density (1010 cells and R0 = 108).

