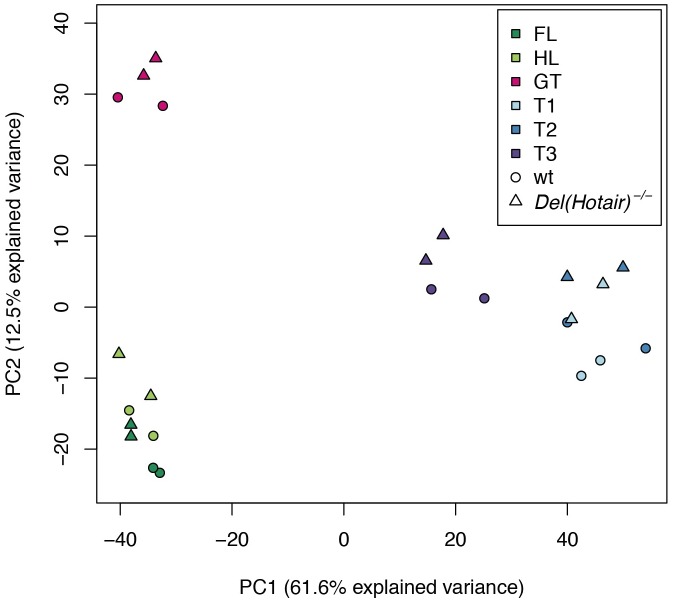
Fig 3. Overview of gene expression patterns in wild type and Del(Hotair)-/- embryonic tissues.
First factorial map for the principal component analysis (PCA) of gene expression levels. Tissues are color-coded (upper right corner) and the genotypes are indicated by either a circle (wild type) or a triangle (Del(Hotair)-/-). The numbers in parentheses indicate the proportion of the variance explained by PC1 or by PC2.

