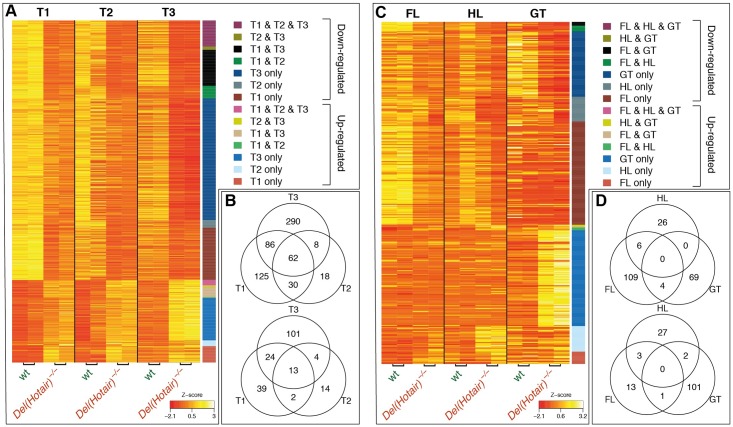
Fig 4. Differential expression between wild type and Del(Hotair)-/- dissected samples.
A-B) Differential gene expression analysis between wild type and Del(Hotair)-/- trunk tissues (T1, T2, T3). The absolute fold change is > 1.5 and FDR < 0.05. The different columns correspond to sample type and rows correspond to differentially expressed genes. (A) Heat map of centered and scaled gene expression levels (Z-score log2 RPKM). Genes are color coded vertically, according to tissue and expression changes between genotypes. (B) Venn diagram showing the number of down-regulated (top) and up-regulated (bottom) genes. C-D) Differential gene expression analysis between wild type and Del(Hotair)-/- forelimbs (FL), hindlimbs (HL) and genital tubercle (GT). The absolute fold change is > 1.5 and FDR < 0.05. (C) Heat map of centered and scaled gene expression levels (Z-score log2 RPKM). Genes are color coded vertically according to the tissue and orientation of expression between genotypes. (D) Venn diagram showing the number of down-regulated (top) and up regulated (bottom) genes.

