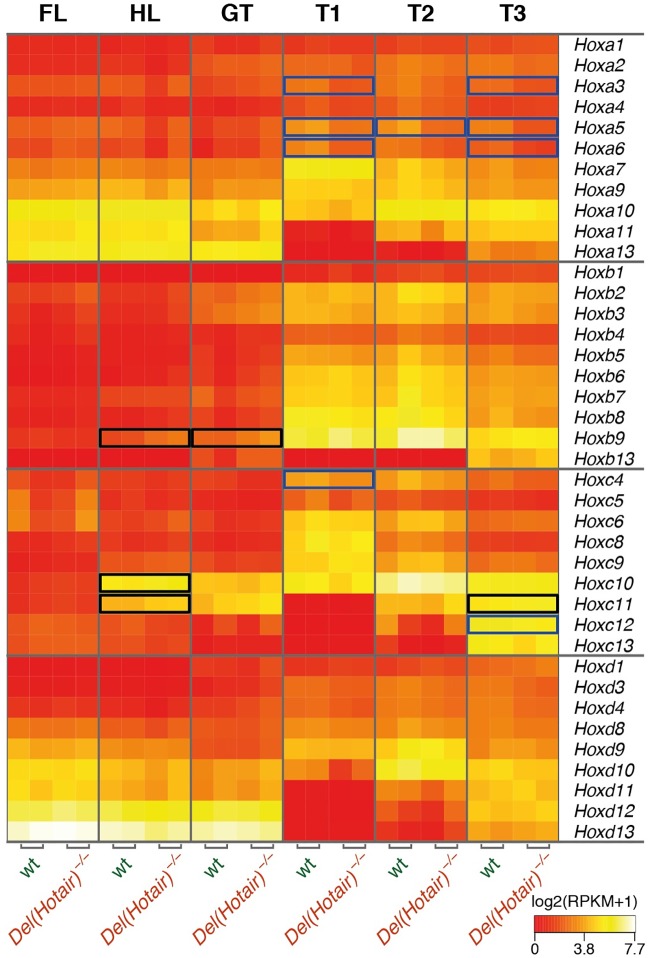
Fig 5. Expression of Hox genes in the various wild type and Del(Hotair)-/- embryonic tissues.
Heat map of log2-transformed RPKM expression levels for all Hox genes. The columns correspond to sample type (indicated on top) and the rows correspond to Hox genes (indicated on the right). The blue boxes point to down-regulated genes, whereas the black boxes indicate up-regulated genes (FDR < 10%, no minimal fold change threshold).

