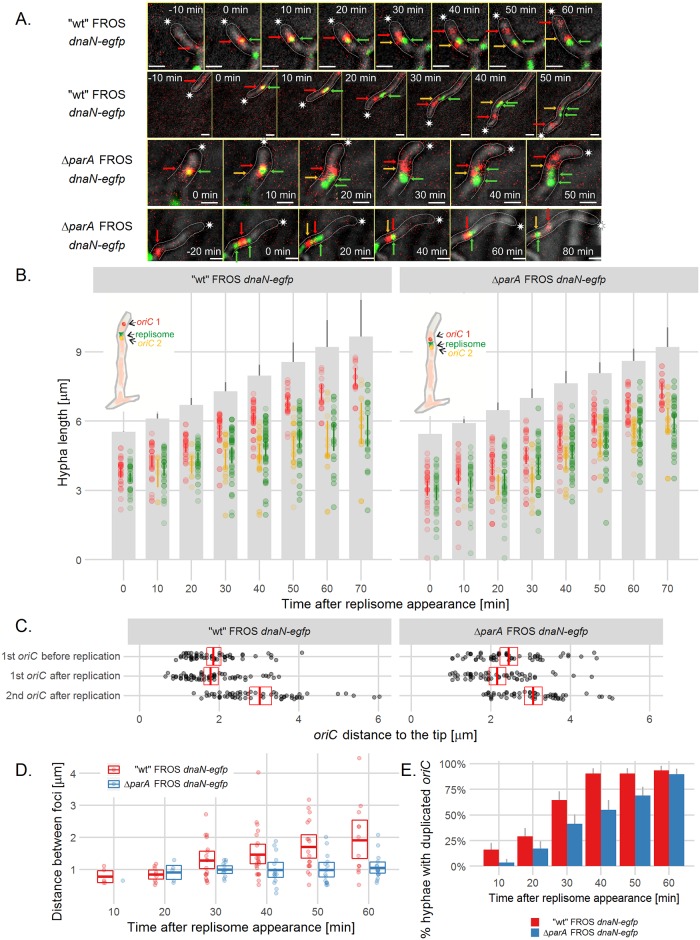
Fig 5. oriC is captured at the tip soon after replication.
(A) Time-lapse snapshots of FROS (TetR-mCherry fluorescence, red) and DnaN-EGFP foci (green) in the extending hyphae of “wild type” FROS dnaN-egfp (AK122) (top panel) and ΔparA FROS dnaN-egfp (AK123) (bottom panel) strains. The fluorescence images are merged with the DIC images (grey) (for separate images of TetR-mCherry overlaid with DnaN-EGFP fluorescence and DIC see S8 Fig). Asterisks indicate the tip of the outlined hyphae, green arrows point to the replisome complex, red arrows point to the tip-proximal oriC, yellow arrows point to tip-distal oriC, scale bar—1 μm. (B) Position of the oriC and DnaN-EGFP complexes in relation to the tips of extending hyphae in “wild type” FROS dnaN-egfp (AK122) (left panel) and ΔparA FROS dnaN-egfp (AK123) (right panel) strains (analyzed for 32 AK122 hyphae and 29 AK123 hyphae). Grey bars are representations of the extending hyphae with 95% confidence interval for hyphae length and semitransparent colored dots represent oriC positions (red: tip-proximal oriC 1, yellow: tip-distal oriC 2, green: replisome, as shown on the schematic drawings), colored lines indicate 95% mean confidence intervals. (C) The distance between the tip and the tip-proximal oriC 10–20 minutes before and 10–20 minutes after oriC duplication in “wild type” FROS dnaN-egfp (AK122) and ΔparA FROS dnaN-egfp (AK123) strains. (D) Distance between duplicated oriCs at the indicated time after replisome appearance in “wild type” FROS dnaN-egfp (AK122) and ΔparA FROS dnaN-egfp (AK123) strains. In C and D panel crossbars show the mean with 95% confidence intervals. (E) Percentage of hyphae in which the duplicated oriCs could be detected at the indicated time after replisome appearance. Error bars show 95% confidence intervals.

