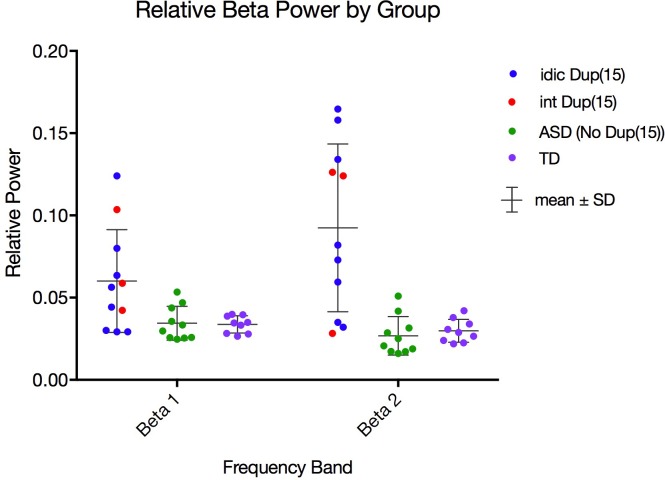
Fig 3. Distributions of relative beta1 and beta2 power for all groups.
Dot plots of relative beta1 (12–20 Hz) power (A) and beta2 (20–30 Hz) power (B) averaged across all ROIs in the Dup15q syndrome group (left), nonsyndromic ASD group (center), and TD group (right). Participants with interstitial duplications [int Dup(15)] are colored red, while participants with isodicentric duplications [idic Dup(15)] are colored blue. Comparison group participants with nonsyndromic ASD are colored green, while children in the TD comparison group are colored purple. The Dup15q cohort features greater mean and standard deviation (mean ± S.D.) in beta1 power (0.060 ± 0.031) and beta2 power (0.092 ± 0.051) in relation to comparison groups [beta1 power: 0.034 ± 0.010 (ASD), 0.034 ± 0.0052 (TD); beta2 power: 0.027 ± 0.012 (ASD), 0.030 ± 0.0070 (TD)].

