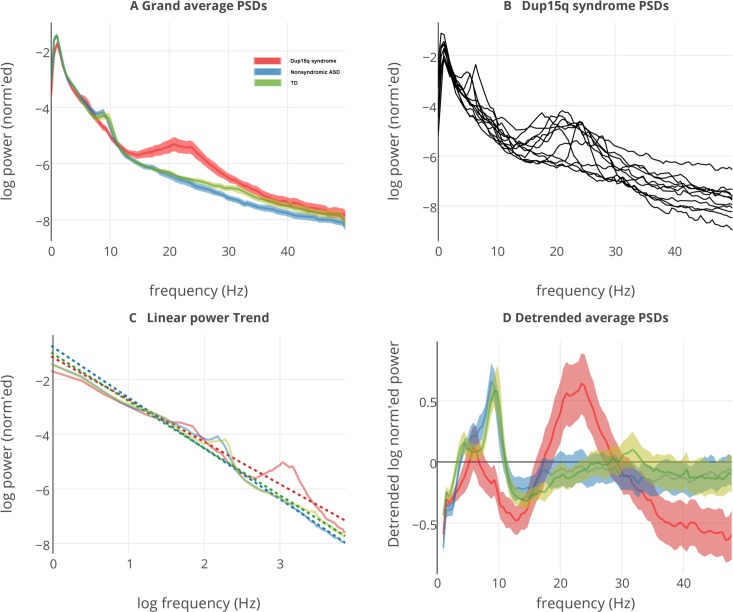
Fig 4. Grand averaged power spectral densities from all groups.
(A) Power spectral densities (PSDs) averaged across all regions of interest (ROIs) and participants for the Dup15q syndrome group (red), nonsyndromic ASD group (blue), and TD group (green). Before averaging, participant PSDs are normalized such that the area under the curve equals 1 to emphasize relative power. Translucent highlights represent standard error of the mean (SEM) computed across participants. An enormous peak from 12–30 Hz reveals the presence of powerful spontaneous beta oscillations (SBOs) in the Dup15q cohort. PSDs are normalized to represent relative power. (B) Individual PSDs, averaged across ROIs, from participants with Dup15q syndrome. (C) Group averaged linear trends (dotted lines) fitted from log-log transformed PSDs. Linear trends represent the 1/f distribution inherent in the EEG. (D) Group averaged PSDs with linear trends removed to emphasize deviations from the 1/f trend. Dup15q syndrome shows the largest deviation, with a peak frequency (~23 Hz) in the beta band. Both comparison groups feature peak frequencies in the alpha band.

