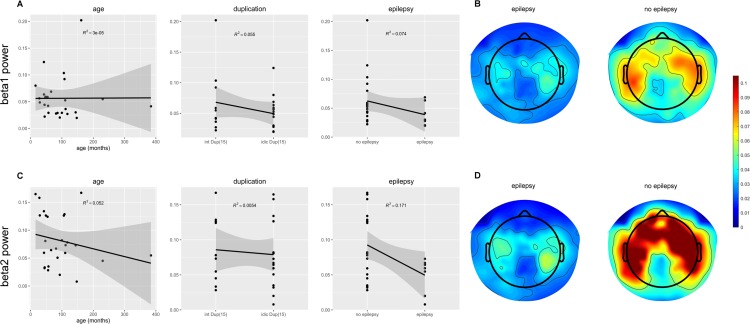
Fig 5. Age, duplication type, and epilepsy as predictors of beta1 and beta2 power.
(A) Scatter plots of age, duplication type, and epilepsy against relative beta1 (12–20 Hz) power. Duplication type and epilepsy are treated as binary variables. Interstitial duplications and no epilepsy are represented as 0; Isodicentric duplications and epilepsy are represented as 1. Highlighted area around regression line represents the 95% confidence region. (B) Topographic scalp plots of beta1 power averaged across participants with epilepsy (left) and without epilepsy (right). (C) Scatter plots of age, duplication type, and epilepsy against relative beta2 (20–30 Hz) power. (D) Topographic scalp plots of beta2 power averaged across participants with epilepsy (left) and without epilepsy (right). The relationship between epilepsy and beta2 power is statistically significant (R2 = 0.17, p = 0.032).

