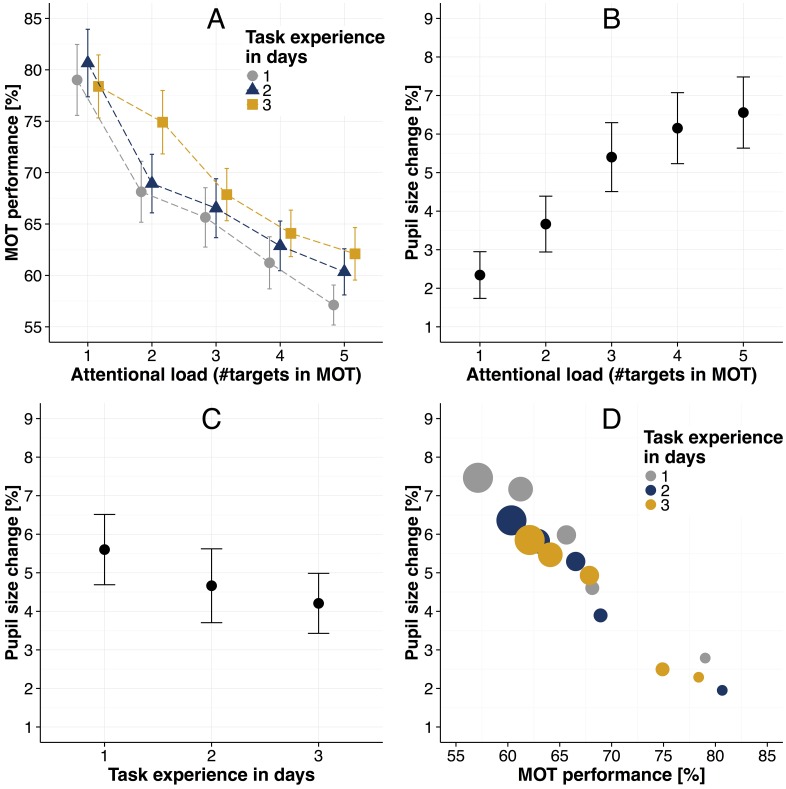
Fig 2. Main experiment results.
(A) MOT task performance (i.e., fraction of correctly selected targets) as a function of attentional load and task experience. (B) Pupil size changes relative to the passive viewing condition as a function of attentional load. (C) Pupil size changes relative to the passive viewing condition as a function of task experience. (D) MOT task performance plotted against the pupil size changes, separately for each day. In addition, the number of targets in the MOT task is coded by the sizes of the circles (i.e., with increasing circle size, the number of targets increases). Error bars in all panels are standard error of the mean.

