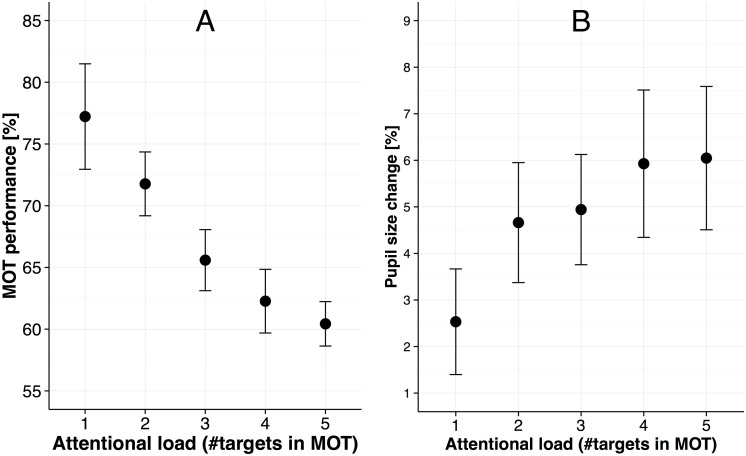
Fig 4. Control experiment results.
(A) MOT task performance (i.e., fraction of correctly selected targets) as a function of attentional load and task experience. (B) Pupil size change relative to the passive viewing condition as a function of attentional load. Error bars in all panels are standard error of the mean.

