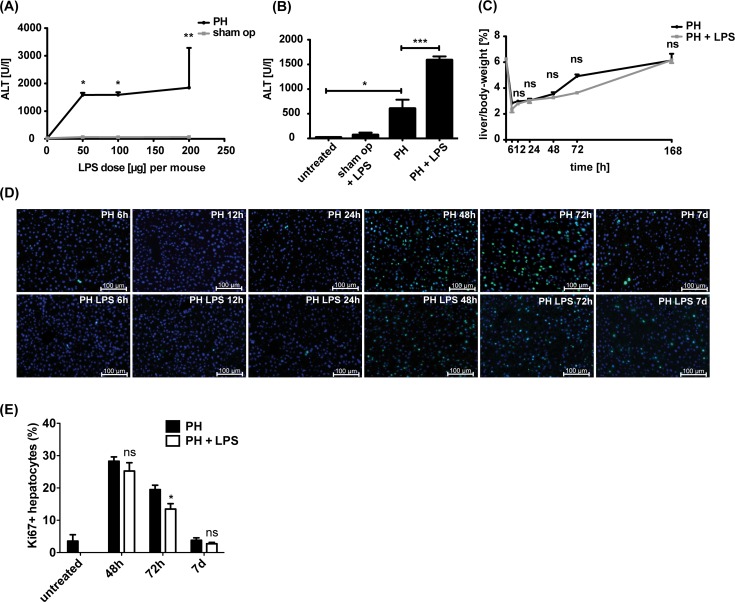
Fig 1. LPS dose-response profile and liver regeneration under low-dose LPS stimulus.
WT mice underwent sham-operation or PH followed by intraperitoneal application of different doses of LPS. LPS dosage per 20g body weight is depicted. (A) Quantitative analysis of the liver specific enzyme alanine-aminotransferase (ALT) 24h post surgery (n = 3). (B) ALT serum levels in WT mice 24h after sham-operation or PH in absence or presence of 50μg LPS per 20g body weight are shown (n = 3). (C) Liver/body-weight-ratio in percent of WT mice at different time points upon PH or PH and LPS application. Seven days (168h) post surgery complete liver regeneration was observed. Graph represents mean ± SD from 3 mice for each setting. (D) Hepatocyte proliferation within the liver parenchyma at distinct time points post-PH or PH and LPS. Proliferating hepatocytes were detected by Ki-67 (green) and nuclear DAPI (blue) using immunofluorescence staining of liver cryosections. Liver sections of non-operated mice served as untreated control. Representative images are shown (n = 3 mice). Scale bars indicate 100μm. (E) Percentage of Ki-67 positive hepatocytes in relation to all hepatocytes was quantified. Mean ± SD from at least 5 cryosections for each time point from two mice (n≥2000 hepatocytes) is shown.

