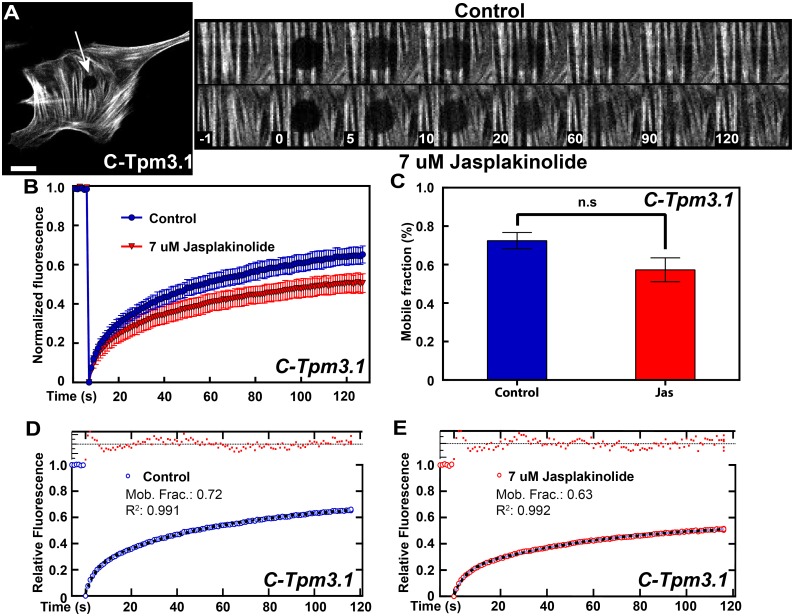
Fig 5. Tpm3.1 maintains constant and rapid cycling on stress fibers in the presence of jasplakinolide.
(A) Representative image and FRAP sequence of MEFs transfected with C-Tpm3.1. FRAP zone indicated by white arrow. Top panel: FRAP sequence of untreated control cells. Bottom panel: FRAP sequence after treatment with 7 μM jasplakinolide. (B) FRAP curves of C-Tpm3.1 in control and drug-treated conditions. (C) Mobile fraction of control and drug-treated condition (see also S5 Table). (D,E) Curve fits for C-Tpm3.1 in control (D) and drug-treated condition (E). Data obtained from 3 separate experiments, 3–8 cells per experiment. Error bars are +/- SEM. Scale bars = 10 μm.

