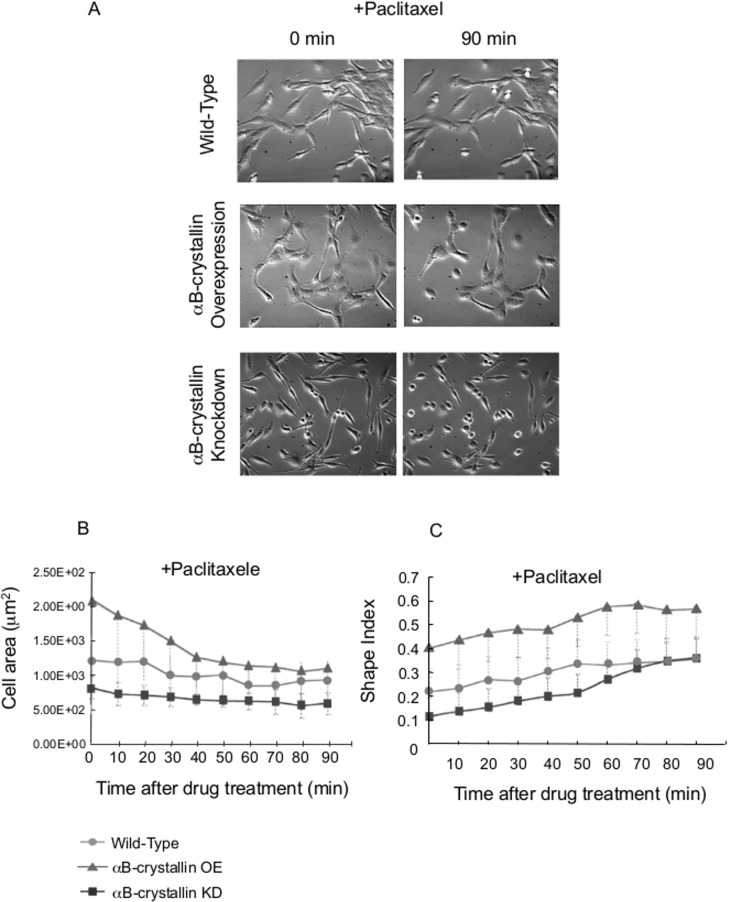
Fig 5. Effect of paclitaxel on αB-crystallin-overexpressing C6 cells and knockdown cells.
Cell shape change after paclitaxel treatment. Just after the addition of drug (final 20 μM; 0 min, left panel) and 90 min later (right panel) (A). Cell area (B) and Shape index (C) change of C6 cells after paclitaxel treatment (final 20 μM). N = 20.

