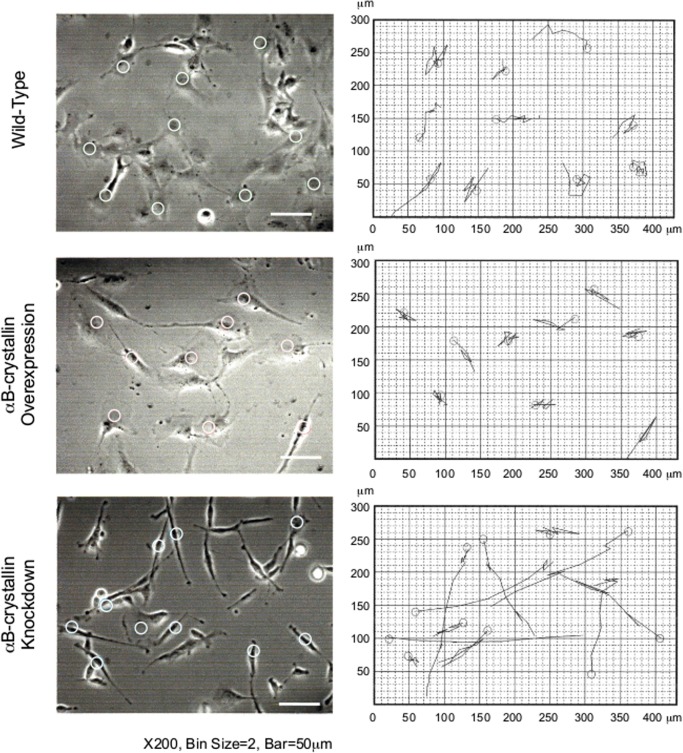
Fig 9. Mode of migration of wild-type, αB-crystallin overexpressing and knockdown cells.
Bar is 50 μm. Time-lapse images were recorded for 2 h at 10 min intervals and traces of the migration were drawn on the right hand graph. Circles on the left panel indicate the center of the cells at the beginning of the image recordings.

