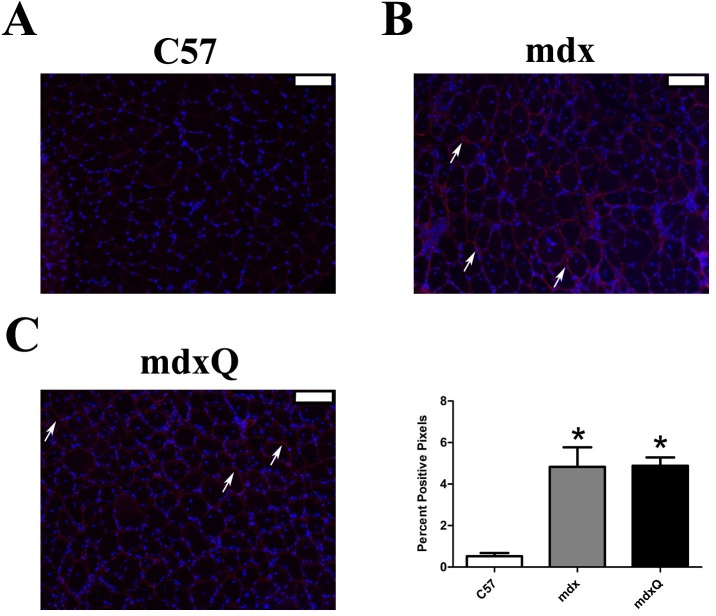
Fig 5. Dystrophin deficiency increased fibronectin in soleus muscles compared to healthy muscles.
A-C) Representative 10x immunohistochemical images for fibronectin (red) and DAPI (blue). All images have been uniformly brightened to make the fibronectin signal easier to see. D) The percent positive pixels were quantified. * indicates significantly different from C57. Width of white bar represents 100 microns. C57 (n = 7) mdx (n = 6) mdxQ (n = 6).

