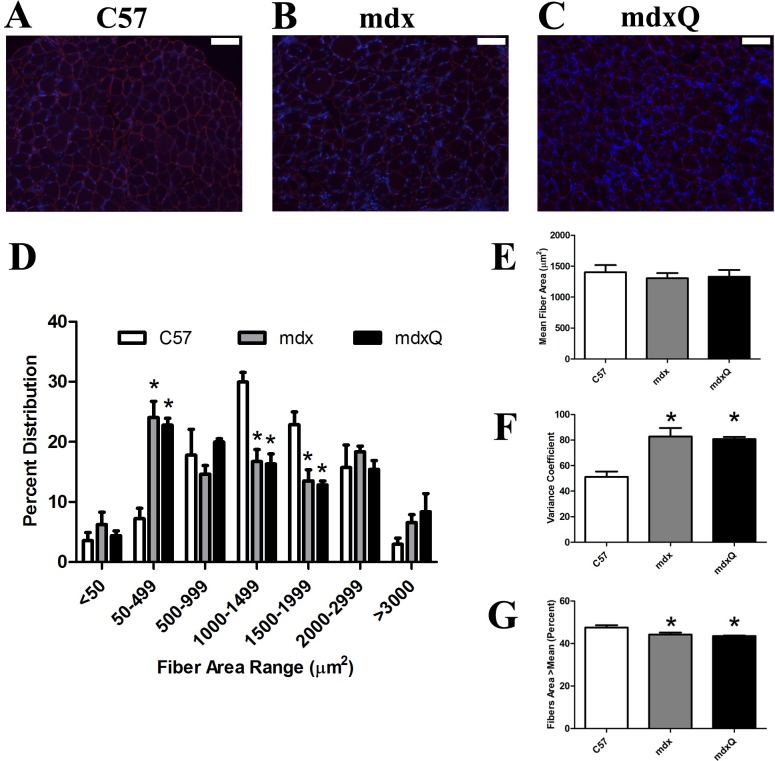
Fig 6. Fiber area distribution is altered by dystrophin deficiency in soleus muscle.
A-C) Representative 10x images from an immunohistological experiment where laminin (red) was detected. DAPI is shown in blue. D) Fiber area distribution was measured and quantified in bins. E) Mean fiber area and F) the variance coefficient were calculated. G) We also determined the percent of fibers greater than the mean cross sectional area as another indicator of fiber area variability. * indicates significantly different from C57. Width of white bar represents 100 microns. C57 (n = 7) mdx (n = 6) mdxQ (n = 6).

