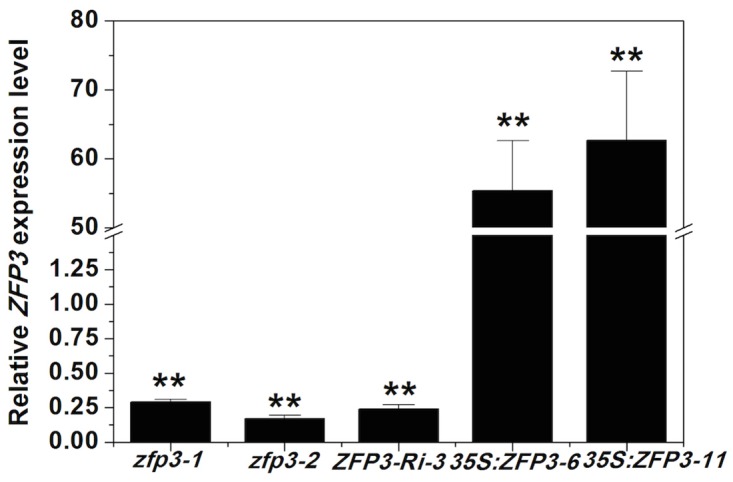
Fig 1. Relative expression levels of ZFP3 in zfp3 and 35:ZFP3 line.

Transcript abundance was measured by real-time RT-PCR and the wild type or the corresponding control values were set at 1. Error bars indicate SD. **, P<0.01(Student’s t-test).

Transcript abundance was measured by real-time RT-PCR and the wild type or the corresponding control values were set at 1. Error bars indicate SD. **, P<0.01(Student’s t-test).