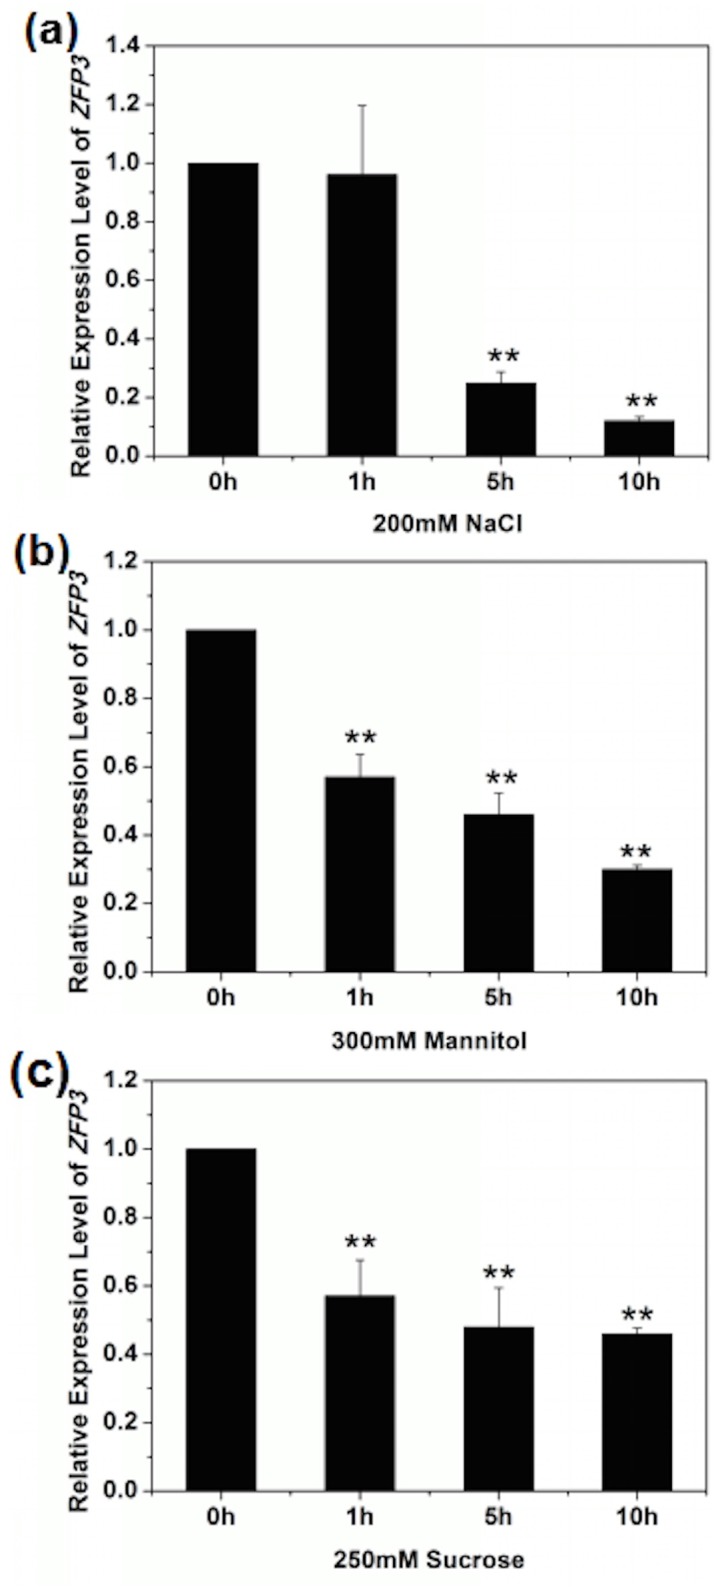
Fig 5. ZFP3 Expression was suppressed by salt and osmatic stress.

(a) Expression level of ZFP3 treated with 200 mM NaCl at different time points. (b) Expression level of ZFP3 treated with 300 mM mannitol at different time points. (c) Expression level of ZFP3 treated with 250 mM sucrose at different time points. The values were normalized against the levels of TUB2 as a control. Error bars indicate SD. *, P<0.05; and **, P<0.01(Student’s t-test).
