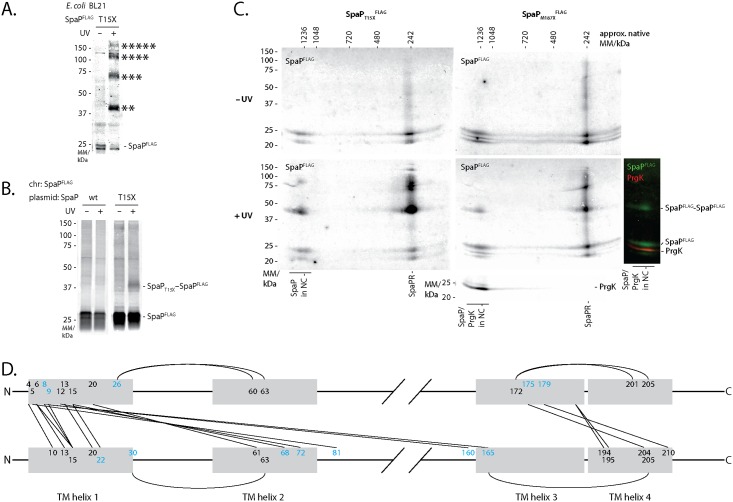
Fig 3. SpaP-SpaP interactions analyzed by in vivo photocrosslinking and sequence co-variation.
(A) Immunodetection of SpaPFLAG on Western blots of crude membrane samples of E. coli BL21 (DE3) expressing SpaPT15XFLAG in the absence of all other T3SS components. The sample is shown with and without UV-irradiation to induce photocrosslinking of pBpa to neighboring interaction partners. (B) Immunodetection of chromosome-encoded SpaPFLAG on Western blots of crude membrane samples of S. Typhimurium expressing plasmid-encoded SpaPT15X. (C) Immunodetection of SpaPFLAG and the inner MS ring protein PrgK on Western blots of crude membrane samples of S. Typhimurium expressing indicated SpaP-pBpa mutants separated by 2-dimensional blue native/SDS PAGE. Full 2D gels are only shown for SpaPFLAG scanned in the 800 nm channel. The 2D gel showing SpaPM187XFLAG +UV has been re-probed with antibody for PrgK and scanned in the 700 nm channel. PrgK indicates the position of the assembled needle complex. An overlay of FLAG and PrgK signals is shown on the right. The relevant slice of the 700 nm image showing PrgK at 25 kDa and the overlay of both channels showing the needle complex-associated bands have been aligned to the corresponding 2D image. (D) Interaction map of SpaP. Lines indicate predicted interactions with a normalized coupling score > 0.8 (S3 Table) at positions with experimentally identified SpaP-SpaP crosslinks (at least from one side). Positions with experimentally observed SpaP-SpaP interactions are shown in black, target positions only predicted are shown in light blue. Grey shading indicates TM helices. Only positions within or in close proximity to TM helices are shown. Abbreviations: chr—chromosomal.

