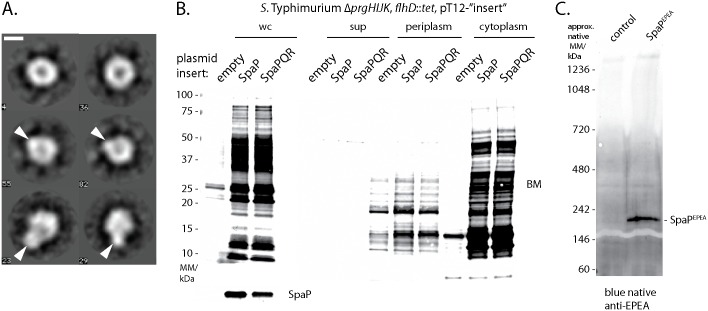
Fig 6. Visualization and characterization of the pore formed by SpaP and SpaR.
(A) Six selected class averages (4, 23, 29, 36, 55, 82) of negative-stained isolated SpaPR complexes imaged by electron microscopy. The length of the scale bar represents 50 Å. The two class averages at the top represent the SpaP5 complex. Arrowheads in the class averages in the middle and at the bottom represent the anticipated position of SpaR on the SpaP5 ring. The complete picture of all class averages can be seen in S4 Fig. (B) Fluorescent streptavidin detection of SDS PAGE-separated biotin maleimide-labeled proteins of whole cell lysates, cell culture supernatant, periplasmic fraction, or cytoplasmic fraction of S. Typhimurium ΔprgHIJK, flhD::tet moderately overexpressing indicated proteins from a medium copy number plasmid (pT12). (C) Blue native PAGE and immunodetection of a high molecular weight complex formed by EPEA-tagged SpaP alone.

