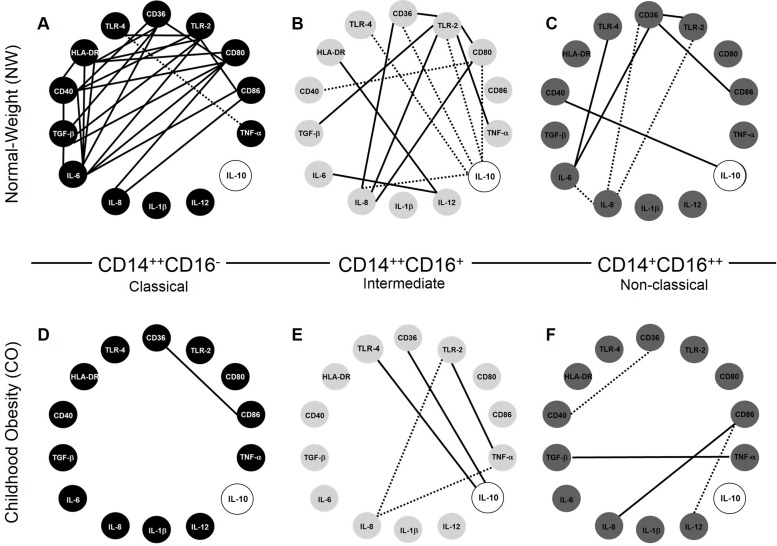
Fig 6. Correlation networks in monocyte subsets.
Correlations network in normal-weight group (NW; n = 9) for classical (A), intermediate (B) and non-classical monocytes (C). Correlations network in childhood obesity group (CO; n = 11) for classical (D), intermediate (E) and non-classical monocytes (F). All correlations shown in networks are strong, presents r-squared higher than 0.63, and statistical significance defined by p<0.05. The continuous lines represent positive correlation and the traced lines represent the negative correlation.

