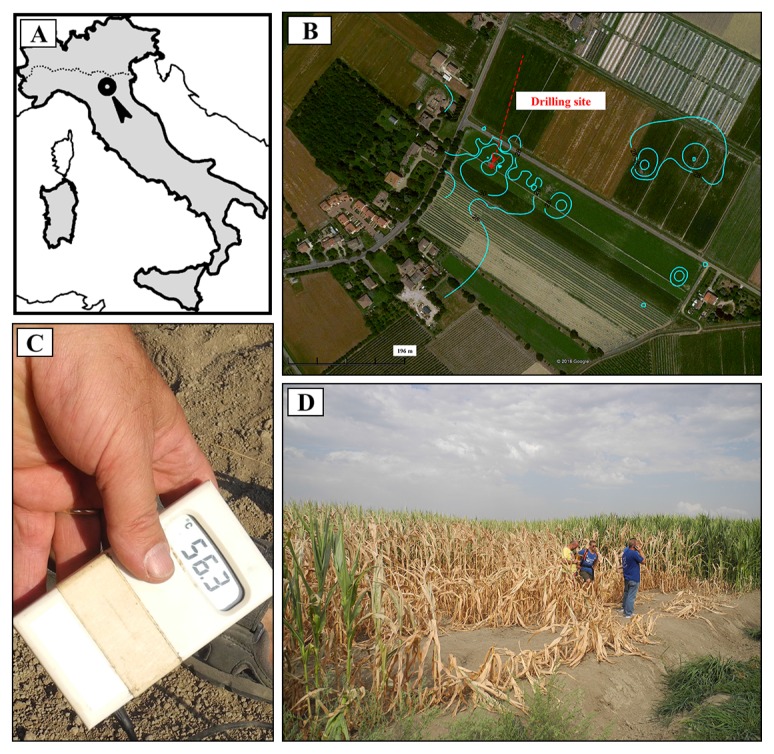
Fig. 1.
A) A map of Italy showing the location of Terre Calde di Medolla (“Hot Lands of Medolla”); B) Aerial photo showing the temperature distribution at Terre Calde di Medolla reported as isothermal curves. The location of the sampling site with soil temperatures of 42°C is also indicated; C) Extreme values of soil temperature ≅55°C measured within the area of Terre Calde di Medolla a few months after the seismic sequence that occurred in May–June 2012 in the Emilia region; D) Picture of a thermally anomalous area with clear signs of affected vegetation.

