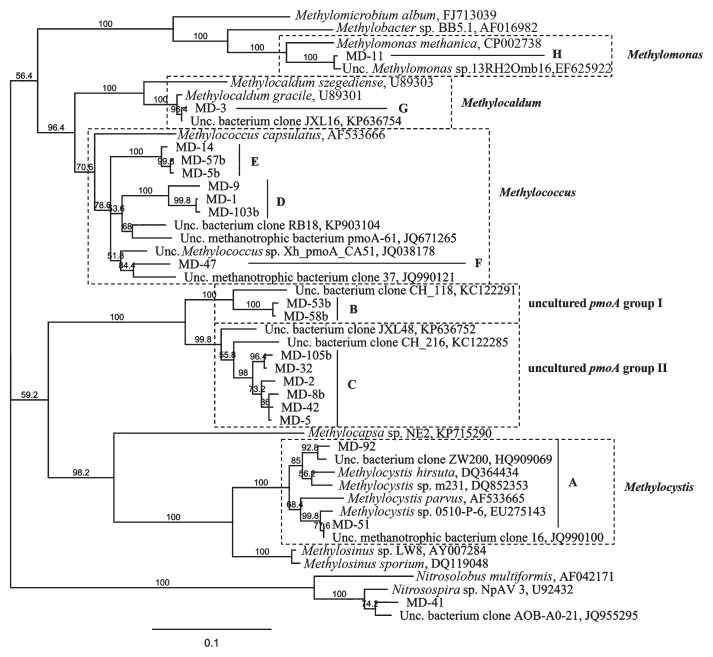
Fig. 3.
Phylogenetic tree of partial pmoA and amoA nucleotide sequences retrieved from an analysis of A189f/A682r and A189f/mb661r clone libraries from 0.6-TCM soil. pmoA clones are grouped into eight groups (A–H) based on at least 90% nucleotide sequence identity. GenBank accession numbers are shown for sequences of cultured methanotrophs and clones from other studies. The bar indicates 10% sequence divergence. Bootstrap values are given and based on 500 data resampling. Boxes marked by dashed lines show the phylogenetic affiliations of the pmoA clones from 0.6-TCM soil.

