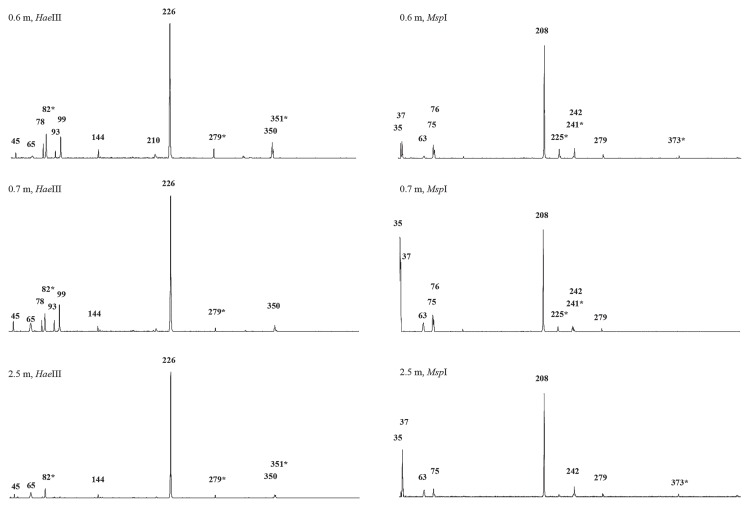
Fig. 4.
Comparison of representative T-RFLP patterns of pmoA products amplified from DNA extracted from different ground depths of TCM (0.6-, 0.7- and 2.5-TCM soil). The lengths of significant T-RFs (signal intensity greater than the threshold of 1%) are reported. See Table 3 for the assignment of T-RFs to methanotrophic species/clones revealed from clone library screening. Putative peaks representing partial digestion are depicted by asterisks.

