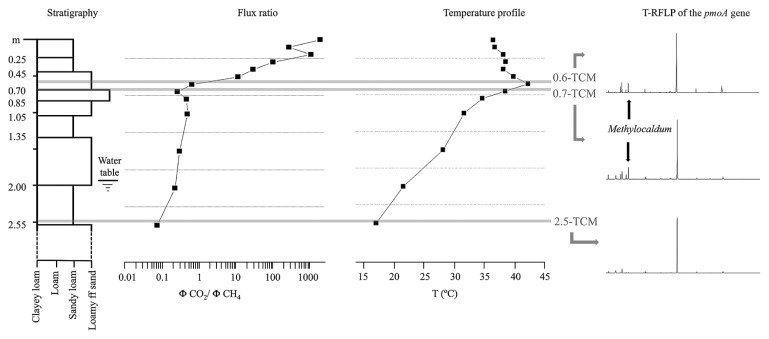
Fig. 5.
Visual representation of the vertical variability of sedimentological features (from the surface downwards to a depth of 2.5 m) associated with the corresponding profiles of temperature, the CO2/CH4 flux ratio, and T-RFLP patterns (HaeIII-based digestion) representing methanotrophic diversity in soil collected at depths of 0.6, 0.7, and 2.5 m. The T-RF corresponding to the genus Methylocaldum is highlighted in samples from depths of 0.6 and 0.7 m.

