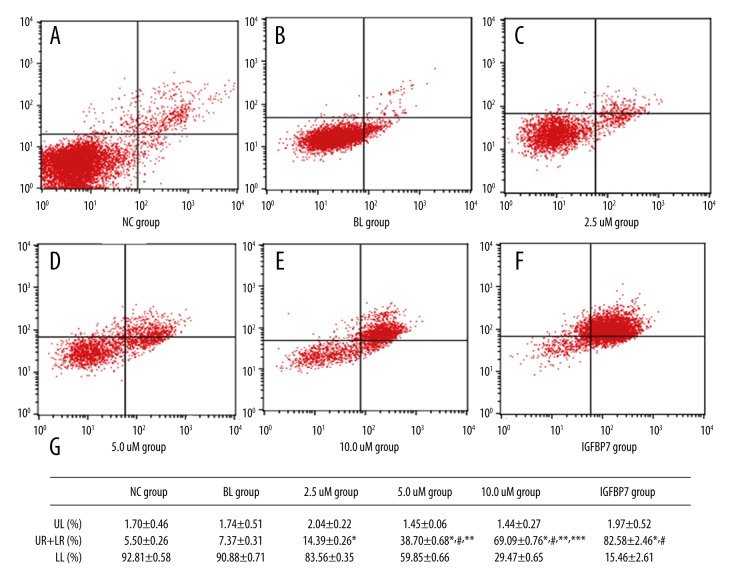
Figure 1.
The apoptosis in the 6 groups. (A) The apoptosis in the NC group. (B) The apoptosis in the BL group. (C) The apoptosis in the 2.5 uM group. (D) The apoptosis in the 5.0 uM group. (E) The apoptosis in the 10.0 uM group. (F) The apoptosis in the IGFBP7 group. (G) Differences in apoptosis among the 6 groups.

