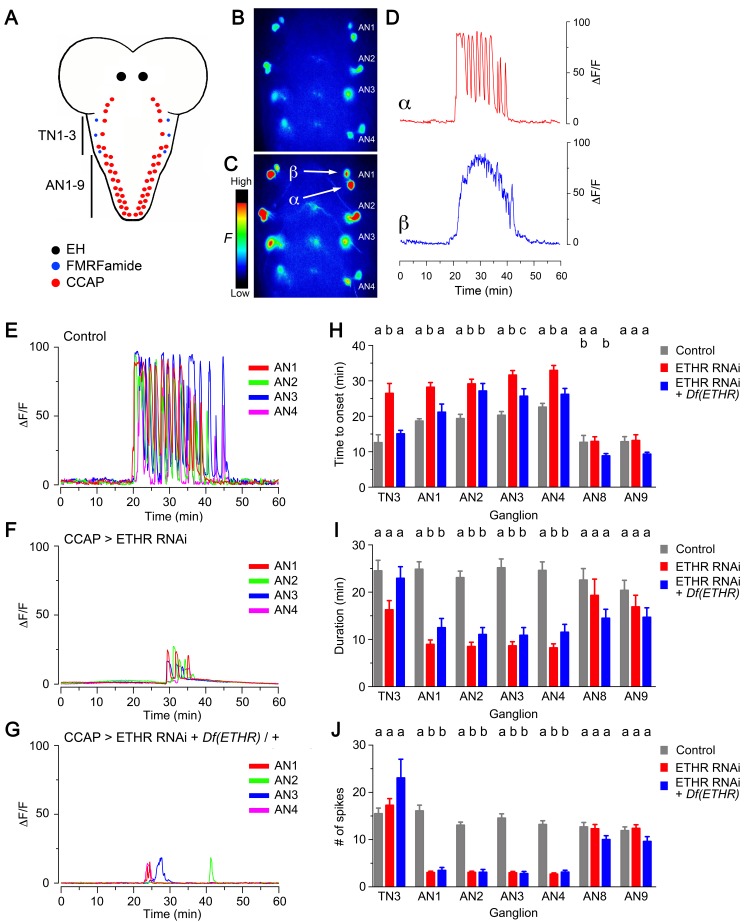
Figure 3. Impact on CCAP neuron activation of ETHR knockdown in CCAP neurons.
(A) Schematic of Drosophila nervous system indicating the location of EH, FMRFa, and CCAP neurons. (B–C) Snapshots of the pattern of GCaMP signal in CCAP neurons in segments AN1-4, recorded from wild-type animals at 0 min (B) and 20 min (C) after in vitro challenge with 600 nM ETH. (D) Calcium dynamics of AN1 α (top, red trace) and β (lower, blue trace) neurons (cf., 3C) after ETH challenge. (E–G) Pattern of GCaMP activity recorded from CCAP neurons AN1-4 following in vitro challenge with 600 nM ETH in wildtype CNSs (E), in CNSs expressing ETHR RNAi in CCAP neurons (F), and in CNSs of ETHR hemizygous animals expressing ETHR RNAi in CCAP neurons (G). (H–J) Quantitation of time of onset (H), duration (I), and number of spikes (J) for the different genotypes tested. TN3: thoracic ganglion 3; AN: abdominal ganglion. Zero min indicates time of ETH challenge. N = 10 preparations for all genotypes. Data are mean ± SEM. Different letters indicate statistically significant groups (p<0.05); one-way ANOVA, Tukey's post-hoc multiple comparison analyses. Actual p values can be found in Supplementary file 1. Genotypes: all animals expressed GCaMP under control of Ccap-GAL4 (Ccap-GAL4 + UAS-GCaMP); ETHR RNAi: UAS-ETHR RNAi; Df(ETHR)/+: hemizygosity for ETHR. In all experiments using RNAi, its effectiveness was boosted by including a UAS-dcr2 transgene.


