. 2016 Nov 23;5:e19881. doi: 10.7554/eLife.19881

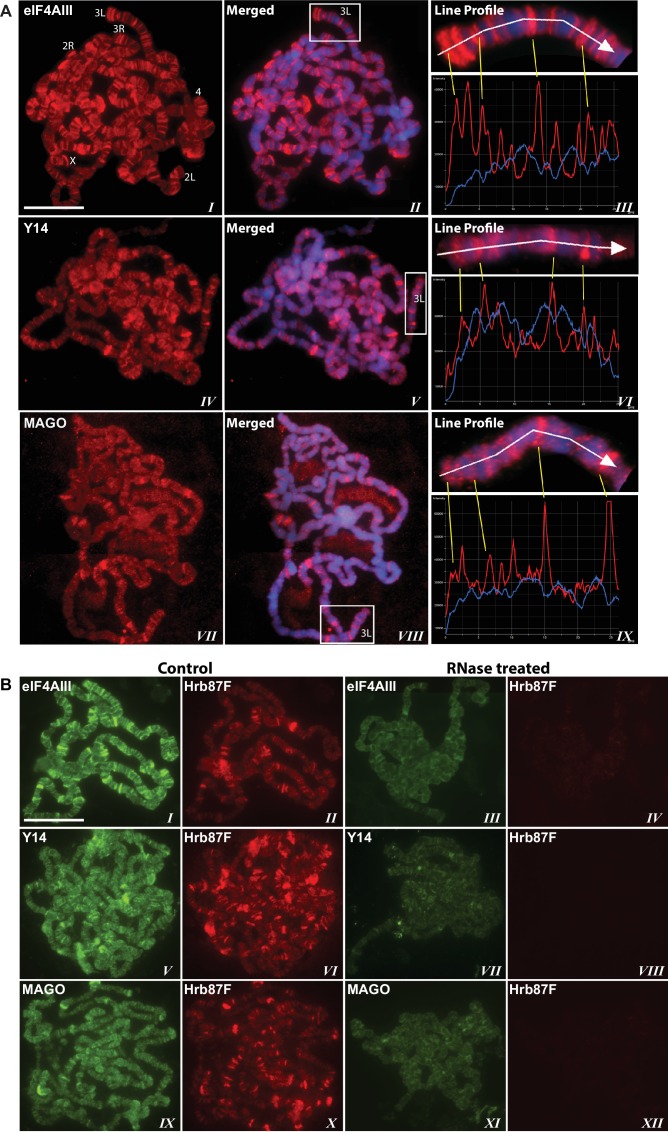
Figure 1. The EJC core proteins associate with nascent transcripts at polytene chromosomes.

(A) Immunolocalization of EJC proteins (red), eIF4AIII (I-III), Y14 (IV-VI) and MAGO (VII-IX), on salivary gland polytene chromosomes of wandering third instar larvae. Chromosomes were counter-stained with DAPI (blue). Intensity profiles of EJC protein and DAPI signals (III, VI, IX) over a segment at the tip of chromosome 3L (box in merged images) show accumulation of these proteins at interband regions. Scale bar represents 20 µm length. (B) Parallel immunolocalization of EJC proteins (green) and Hrb87F (hnRNP A1) (red) on polytene chromosomes spread from salivary gland without treatment (Control) or after incubation with RNase (RNase treated). Scale bar represent 20 µm length.

DOI: http://dx.doi.org/10.7554/eLife.19881.003

Figure 1.

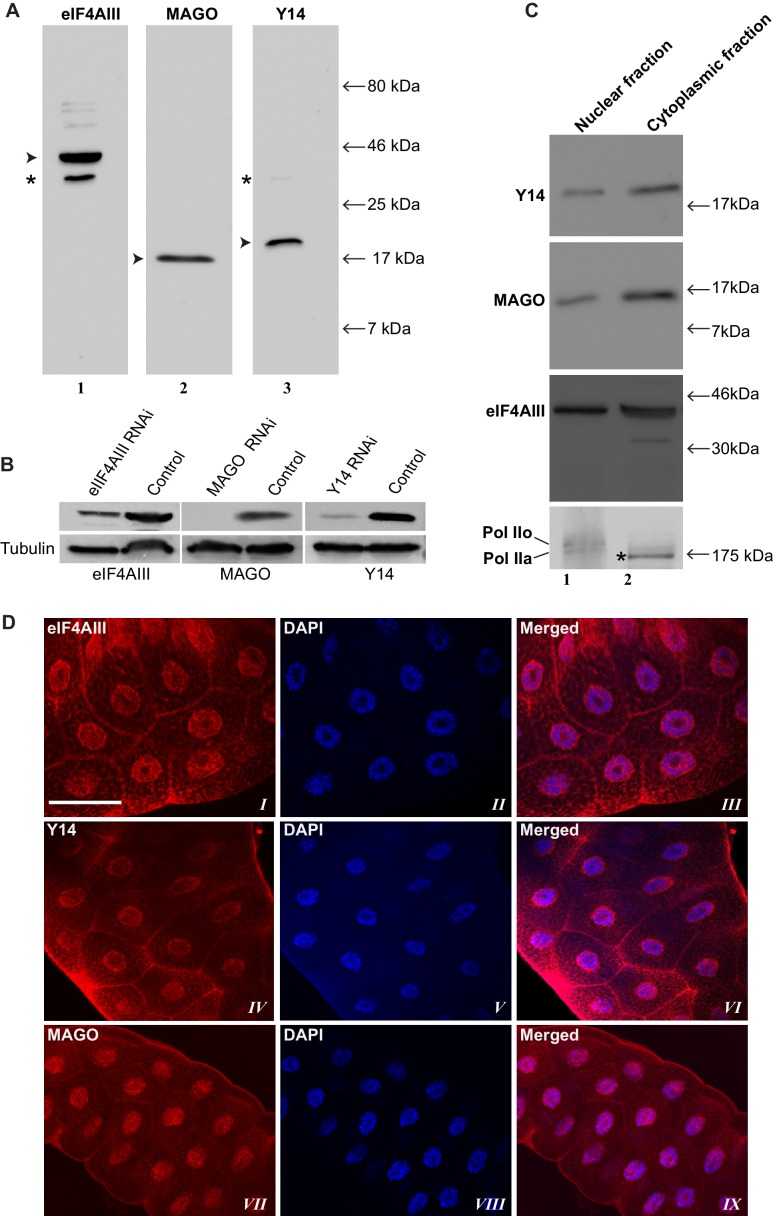
Figure 1—figure supplement 1. Characterization of EJC antibodies.

Figure 1—figure supplement 1.

(A) Western blot of S2 cell protein extracts treated with antibodies against eIF4AIII (lane I), MAGO (lane II) and Y14 (lane III) proteins of 46, 17 and 19 kDa expected molecular weight, respectively. Asterisks in lanes 1 and 3 indicate bands of unexpected size, but possibly specific as their intensity is also reduced by RNAi of the target transcript, not shown. (B) Western blot showing that EJC antibodies, used in present study, specifically detect down-regulation of their antigen protein in its RNAi samples. (C) Western blot showing levels of Y14, MAGO and eIF4AIII in nuclear and cytoplasmic fractions of S2 cells. RNA Pol II is shown at the bottom (detected using 8WG16 antibody) as fractionation control; the two expected bands Pol IIo and Pol IIa are indicated. Asterisk indicates a nonspecific band detected in the cytoplasmic fraction. (D) Immunolocalization of eIF4AIII (I-III), Y14 (IV-VI) and MAGO (VII-IX) in whole mount salivary glands of wild-type third instar larvae. Chromosomes were counterstained with DAPI (blue). Scale bar represents 50 µm length.
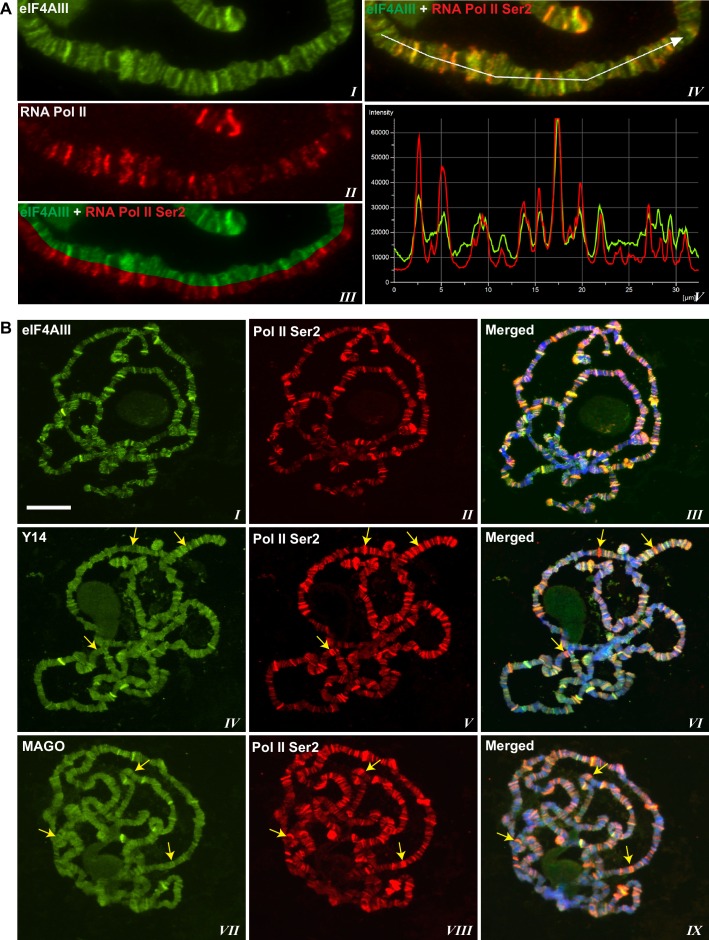
Figure 1—figure supplement 2. EJC protein signals co-localize with active Pol II.

Figure 1—figure supplement 2.

(A) Magnified view of a chromosome segment of a chromosome showing eIF4AIII (green, I) and Pol II Ser2 (red, II). The split image (III) shows eIF4AIII (green) above and Pol II Ser2 (red) below on same arm. Right panel shows a line drawn on the same segment (IV) and corresponding intensity profile of both of the proteins (V). (B) Double immunostaining of RNA Pol II Ser2 (red) and EJC proteins (green); eIF4AIII (top row), Y14 (middle row) and MAGO (bottom row). Yellow arrows in the middle and bottom row indicate absence of Y14 and MAGO, respectively, at transcription sites marked with intense Pol II Ser2 signal (red). Scale bar represents 20 µm length.
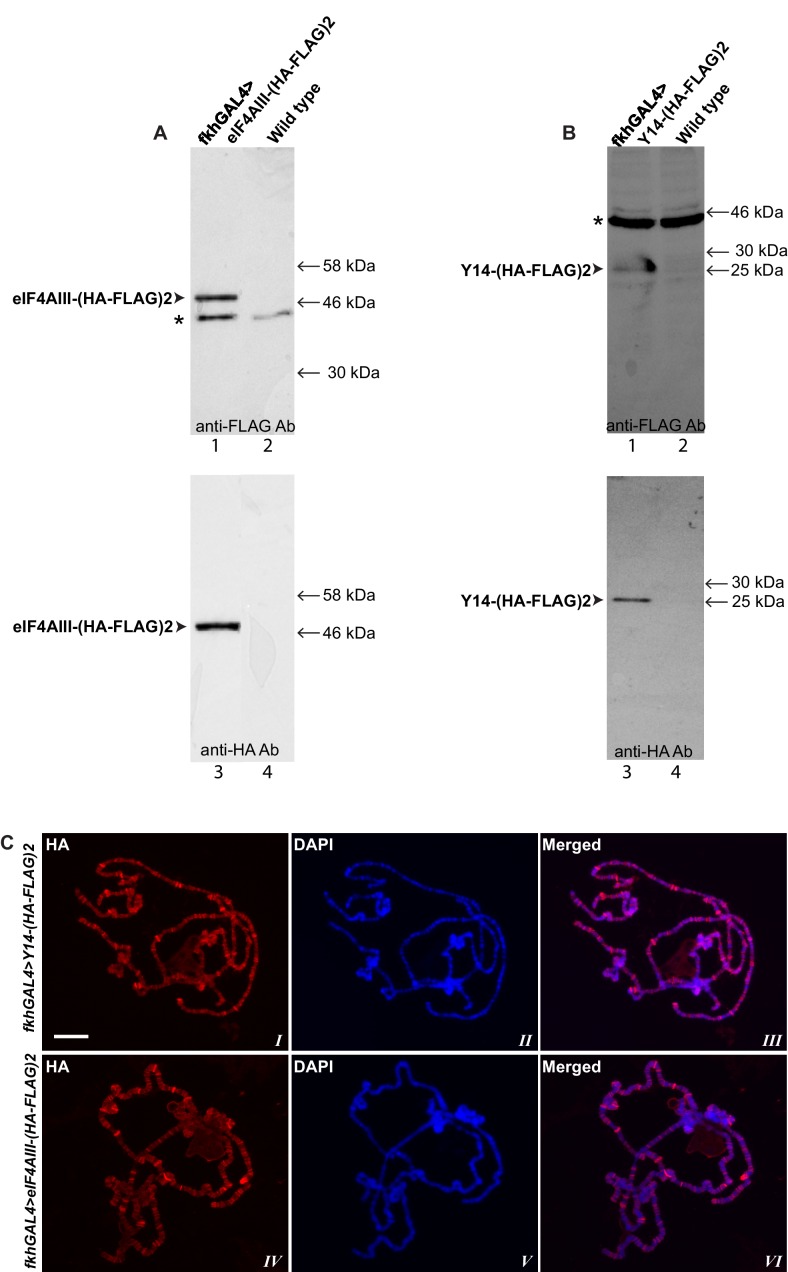
Figure 1—figure supplement 3. Characterization of transgenic flies expressing tagged Y14 or eIF4AIII.

Figure 1—figure supplement 3.

(A) Western blotting of protein extracts of salivary glands from transgenic flies expressing double tagged eIF4AIII-(HA-FLAG)2 detected either with anti-FLAG (lanes, 1 and 2) or with anti-HA antibody (3, 4). (B) Western blotting of protein extracts of salivary glands from transgenes expressing Y14-(HA-FLAG)2 by using anti-FLAG (1, 2) and anti-HA antibodies (3, 4). (C) Immunolocalization of tagged Y14 (red, I, III) and eIF4AIII (red, IV, VI) by using anti-HA antibody, in genotypes indicated on the left of each row. Chromosomes were counterstained with DAPI (blue). Scale bar represents 20 µm length.
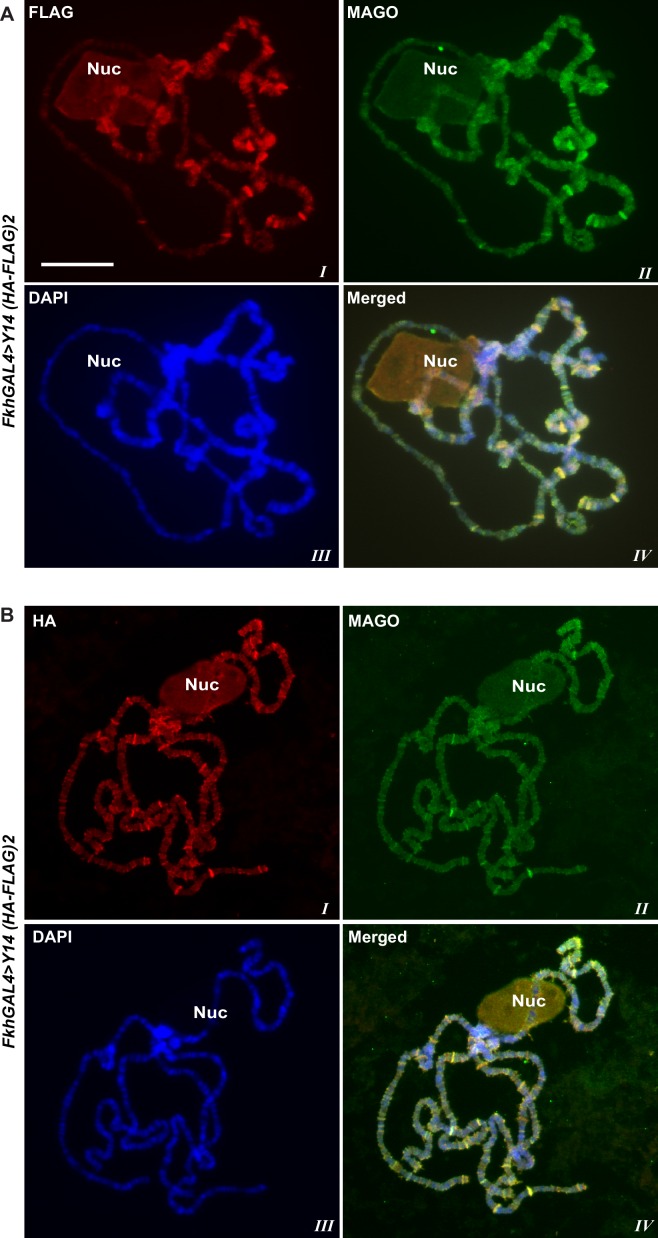
Figure 1—figure supplement 4. Y14 and MAGO strictly colocalize at transcription sites.

Figure 1—figure supplement 4.

(A) Parallel immunostaining of tagged Y14 (red) detected with anti-FLAG and endogenous MAGO (green) on polytene chromosomes squash of fkhGAL4>Y14 (HA-FLAG)2. (B) Similar chromosomes immunostaining as in A using anti HA instead of anti-FLAG. Scale bar represents 20 µm length and applies for both panels.
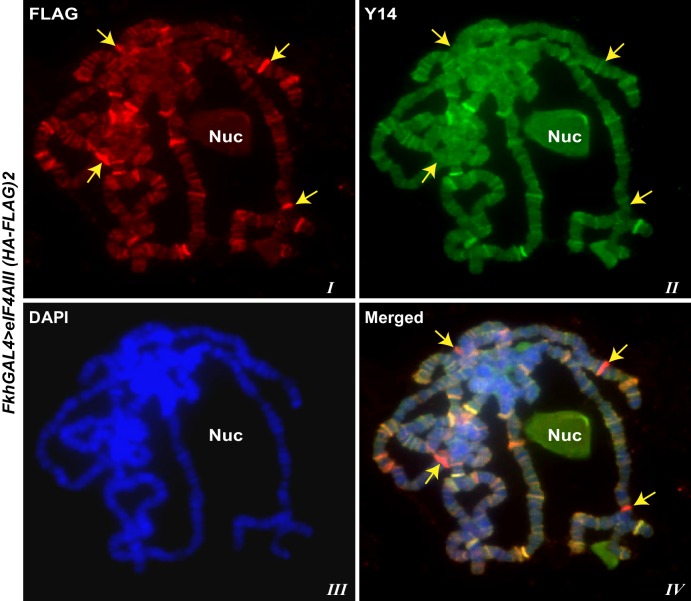
Figure 1—figure supplement 5. Y14 banding pattern differs from that of eIF4AIII.

Figure 1—figure supplement 5.

Parallel immunostaining of tagged eIF4AIII (red) and endogenous Y14 (green) on polytene chromosomes squash of fkhGAL4>eIF4AIII (HA-FLAG)2 larvae. Arrows are indicating sites with strong eIF4AIII but with weak or absent Y14 signal. Chromosomes were counterstained with DAPI (blue).