. 2016 Nov 17;5:e18657. doi: 10.7554/eLife.18657

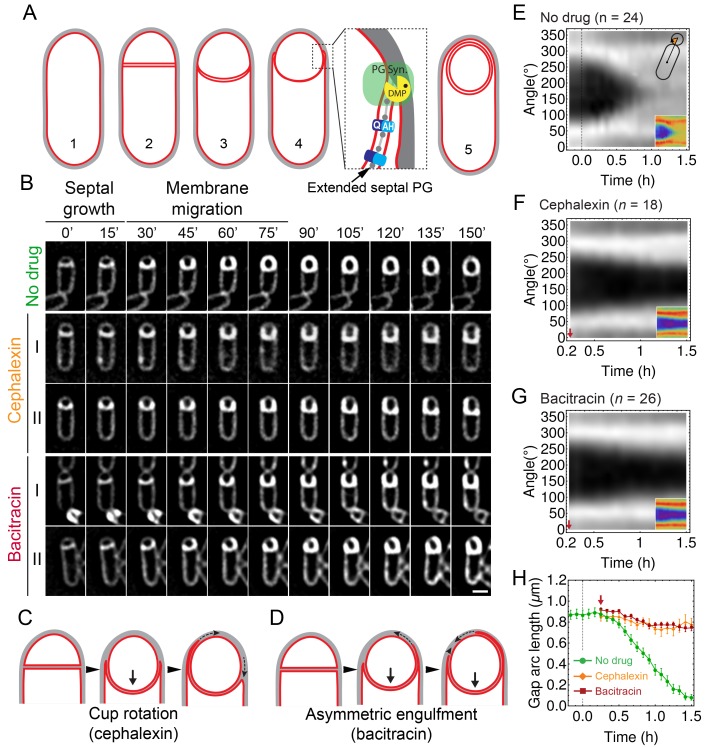
Figure 1. Peptidoglycan (PG) synthesis is essential for leading-edge (LE) migration.

(A) Morphological changes during spore formation. Peptidoglycan shown in grey, membrane in red. (1) Vegetative cell. (2) The first morphological step in sporulation is asymmetric cell division, producing a smaller forespore and a larger mother cell. (3) The septum curves and protrudes towards the mother cell. (4) The mother cell membrane migrates towards the forespore pole. The different modules contributing to membrane migration are shown in the inset (see Introduction for details). During engulfment, the septal PG is extended around the forespore (Tocheva et al., 2013). (5) Fully engulfed forespore surrounded by two membranes sandwiching a thin layer of PG. (B) Snapshots of engulfing sporangia from time-lapse movies in the absence of antibiotics, or in the presence of cephalexin or bacitracin. Cells were stained with fluorescent membrane dye FM 4–64 and imaged in medial focal plane. In the absence of antibiotics (top) the septum curves and grows towards the mother cell without significant forward movement of the engulfing membrane for ∼20 min. After that, the LE of the engulfing membrane starts migrating and reaches the forespore pole in ∼1 hr. When PG precursor delivery system is blocked with bacitracin (50 μg/ml): (I) LE migration is stopped or (II) engulfment proceeds asymmetrically. Similar results are obtained when cells are treated with cephalexin (50 μg/ml). However, in this case the asymmetric engulfment phenotype observed at later time points is due to rotation of the engulfment cup (C) rather than to asymmetric movement forward of the engulfing membrane (D). (E) FM 4–64 average kymograph of n = 24 engulfing cells (see Materials and methods, Appendix 1). Average fluorescent intensity along forespore contour vs time in the mother-forespore reference frame as shown in top inset. All cells are aligned in time based on time 0’ (0 min). Time 0’ is assigned to the onset of curving septum (Figure 1—figure supplement 3). Bottom inset is average kymograph represented as heat map. (FG) Average kymograph for cells treated with cephalexin (n = 18) (F) or bacitracin (n = 26). (G) When drug was added analyzed cells had (55 ± 5)% engulfment (red arrow). The percentage of engulfment is calculated as total angle of forespore covered with mother membrane divided by full angle. All cells had fully curved septum. Non-engulfed part of the forespore is represented as the black regions in kymographs. (H) In untreated sporangia, gap starts to close ∼20 min after onset of membrane curving. In antibiotic-treated cells gap does not close. Sample size as in (FG). Red arrow points when drug is added. Average ± SEM. Scale bar 1 μm.

DOI: http://dx.doi.org/10.7554/eLife.18657.003

Figure 1.

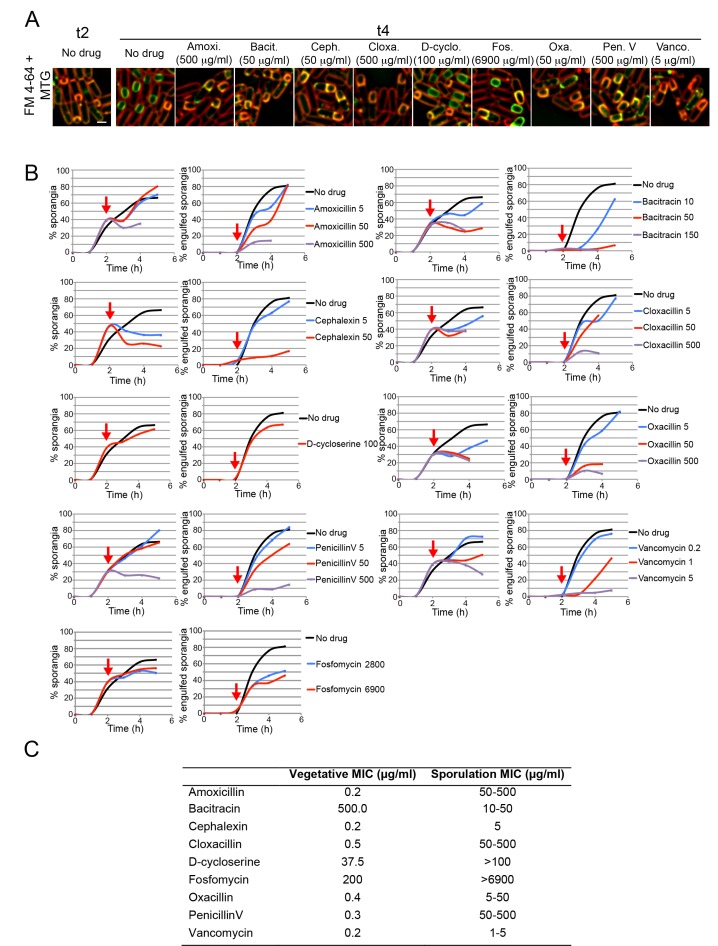
Figure 1—figure supplement 1. Sporulation minimal inhibitory concentration.

Figure 1—figure supplement 1.

(A) Microscopy pictures of cells sporulating before antibiotic treatment (t2), or 2 hr later (t4) after treatment with antibiotics blocking different steps on the PG biosynthetic pathway: synthesis of cytoplasmic PG intermediates (D-cycloserine), recycling of undecaprenyl-P (bacitracin), cross-linking of the glycan strands (vancomycin), or PBP activity (amoxicillin, cephalexin, cloxacillin, oxacillin and penicillin V). Cells were stained with Mitotracker Green (green, membrane permeable) and FM 4–64 (red, membrane impermeable) to visualize membranes. When engulfment is completed, the forespore membranes are only stained by Mitotracker green, but not by FM 4–64 (Sharp and Pogliano, 1999). (B) Graphs showing the percentage of cells that have undergone polar septation (% sporangia) and the percentage of sporangia that have completed engulfment (% engulfed sporangia) at different time points after sporulation induction, in cultures treated with different antibiotics that block PG synthesis. Antibiotics were added 2 hr after sporulation induction (red arrows). Samples were taken every hour for 5 hr, stained with MTG and FM 4–64 and visualized under the microscope. More than 300 cells were quantified per time point and antibiotic concentration. (C) Table showing the Minimal Inhibitory Concentration (MIC) of antibiotics blocking PG synthesis during vegetative growth (Vegetative MIC), and the estimated MIC during sporulation (Sporulation MIC). The Sporulation MIC was defined as the concentration or concentration interval that block the formation of new polar septa, and was inferred from the graphs in B. Scale bar 1 μm.

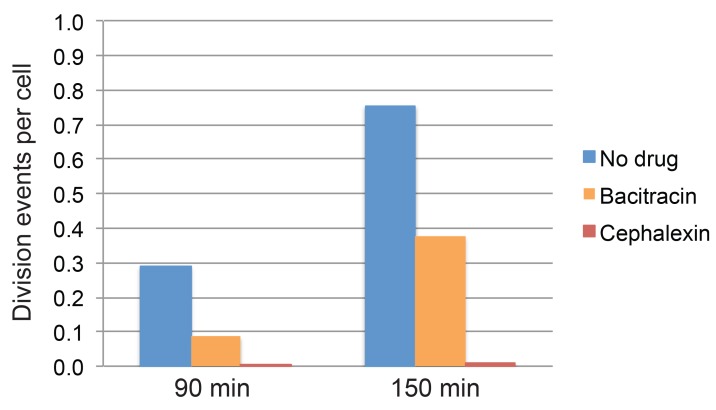
Figure 1—figure supplement 2. Quantification of cell division events in timelapse movies.

Figure 1—figure supplement 2.

Fraction of cell division events per cell observed during the first 90 min and 150 min of imaging in timelapse movies of sporulating cultures treated with bacitracin (50 μg/ml), cephalexin (50 μg/ml), or untreated. At least 296 vegetative cells were tracked over time for every condition. The total number of division events observed after 90 min or 150 min was divided by the number of cells tracked in each case.

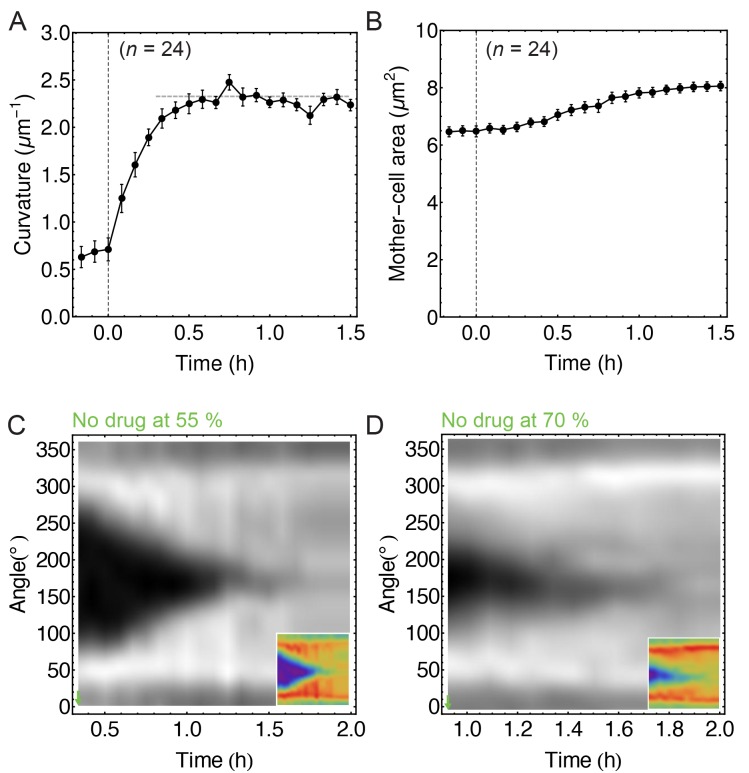
Figure 1—figure supplement 3. Image analysis of non-treated cells.

Figure 1—figure supplement 3.

(A) Time course of septum curvature. The horizontal dashed grey line corresponds to inverse cell-wall radius (FM 4–64) measured at the cell middle (1/R=(2.3±0.4)μm1, n=14). (B) Time course of mother-cell area. (CD) FM 4–64 kymographs of partially engulfed forespores (n = 6 with (55 ± 5)% of engulfment;= 7 with (70 ± 5)% of engulfment, respectively). This is a control analysis of non-treated cells for the experiment when partially engulfed cells treated with drugs stop engulfment (see Figure 1F–G). Average ± SEM.