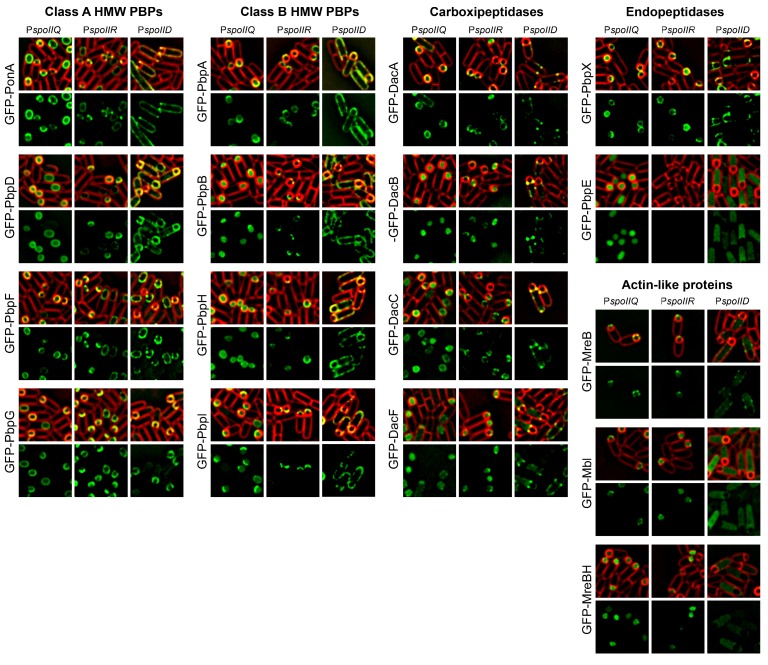
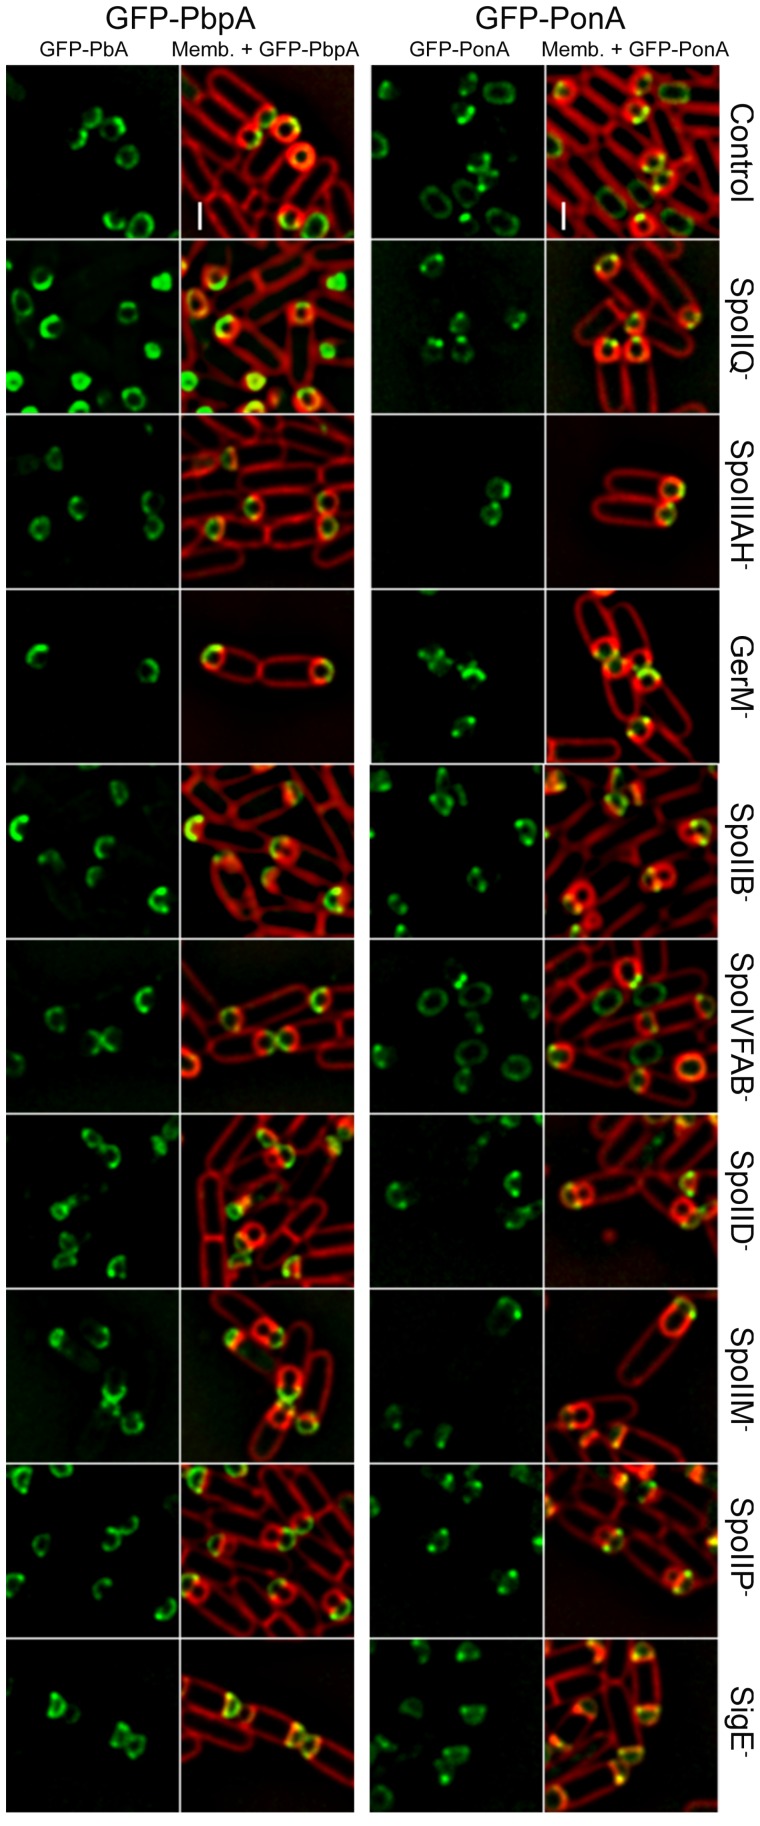
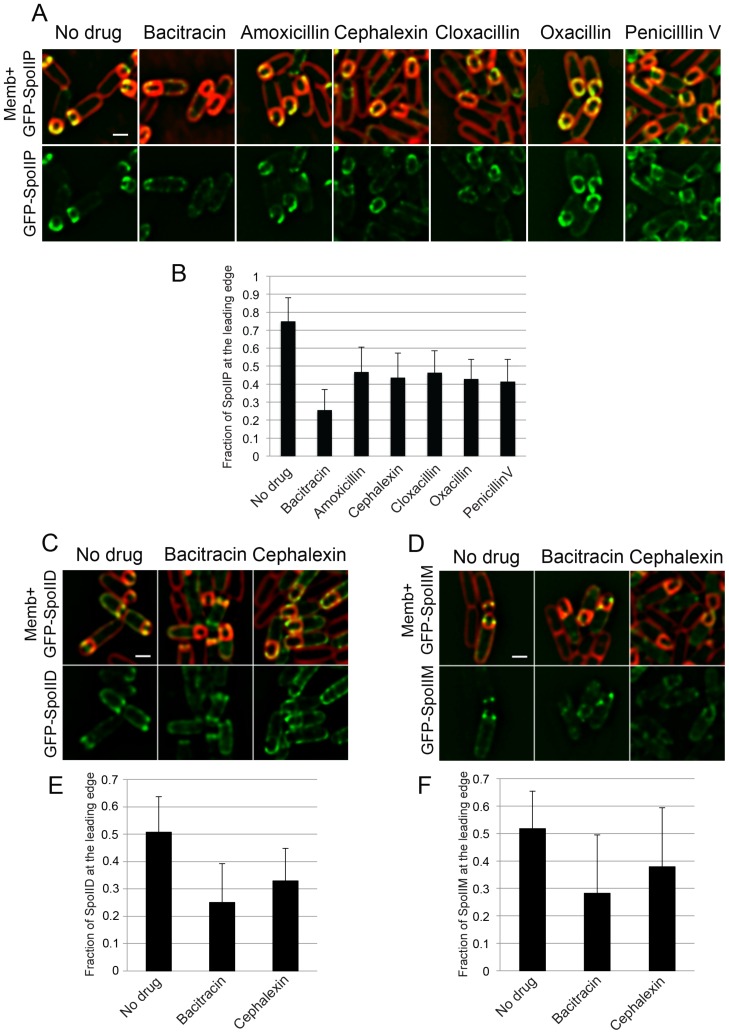
Figure 2. PG synthesis at the LE of the engulfing membrane by forespore PBPs contribute to proper localization of the DMP complex.
(A) Sporulating cells stained with a green fluorescent derivative of penicillin V (BOCILLIN-FL). Bright foci are observed at the LE of the engulfing membrane. Membranes were stained with FM 4–64 (red). (B) Average BOCILLIN-FL (green) and FM 4–64 (red) fluorescence intensities along forespore contours plotted as a function of the degree of engulfment. Cells are binned according to percentage of engulfment. BOCILLIN-FL signal is enriched at the LE throughout engulfment ( = 125). (C) Cell-specific localization of the peptidoglycan biosynthetic machinery. GFP tagged versions of different B. subtilis PBPs and actin-like proteins (ALPs) were produced from mother cell- (MC) or forespore- (FS) specific promoters. (D) Six different localization patterns were observed upon cell-specific localization of PBPs and ALPs. For each pair of images, left panel shows overlay of membrane and GFP fluorescence, while the right panel only shows GFP fluorescence. Pictures of representative cells displaying the different patterns are shown (top, GFP fusion proteins transcribed from spoIIR promoter for forespore-specific expression, and from spoIID promoter for mother cell-specific expression). The six different patterns are depicted in the bottom cartoon and proteins assigned to each one are indicated. Membranes were stained with FM 4–64. See Figure 2—figure supplement 1 for cropped fields of all PBPs we assayed. Transglycosylase (TG), transpetidase (TP), carboxipetidase (CP), endopeptidase (EP), actin-like protein (ALP). (E) TIRF microscopy of forespore-produced GFP-MreB in four different forespores (i to iv). In every case, the leftmost picture is an overlay of the forespore membranes (shown in white) and the tracks followed by individual TIRF images of GFP-MreB (color encodes time, from blue to red). Sporangia are oriented with the forespores up. For the first sporangia (i), snapshots from TIRF timelapse experiments taken 8 s apart are shown. Arrows indicate GFP-MreB foci and are color coded to match the trace shown in the left panel. Rightmost panel for each forespore shows a kymograph representing the fluorescence intensity along the line joining the leading edges of the engulfing membrane over time (from top to bottom; total time 100 s). Average focus speed (n = 14) is indicated at the bottom. Timelapse movies of the examples presented here and additional sporangia are shown in Video 2. (F) Localizaiton of GFP-SpoIIP in untreated sporangia, or in sporangia treated with bacitracin (50 μg/ml) or cephalexin (50 μg/ml). (G) Fraction of GFP-SpoIIP fluorescence at LE of the engulfing membrane. Bars represent the average and standard error of 85 untreated sporangia, 38 sporangia treated with bacitracin (50 μg/ml), and 67 sporangia treated with cephalexin (50 μg/ml). (H) Model for PG synthesis and degradation at the LE of the engulfing membrane. New PG is synthesized ahead of the LE of the engulfing membrane by forespore-associated PG biosynthetic machinery, and is subsequently degraded but the mother-cell DMP complex. We propose that DMP has specificity for the peptide cross-links that join the newly synthesized PG with the lateral cell wall (orange), which leads to the extension of the septal PG around the forespore. Scale bars 1 μm.


