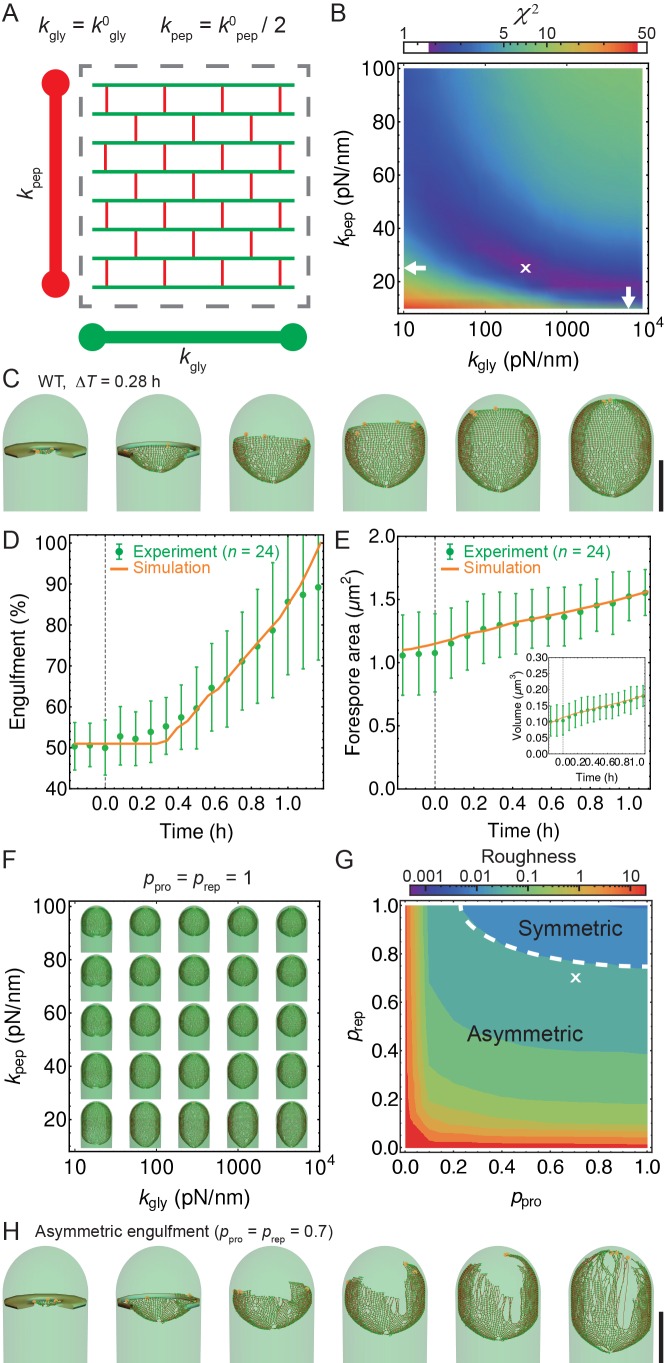
Figure 4. Template model reproduces experimentally observed phenotypes.
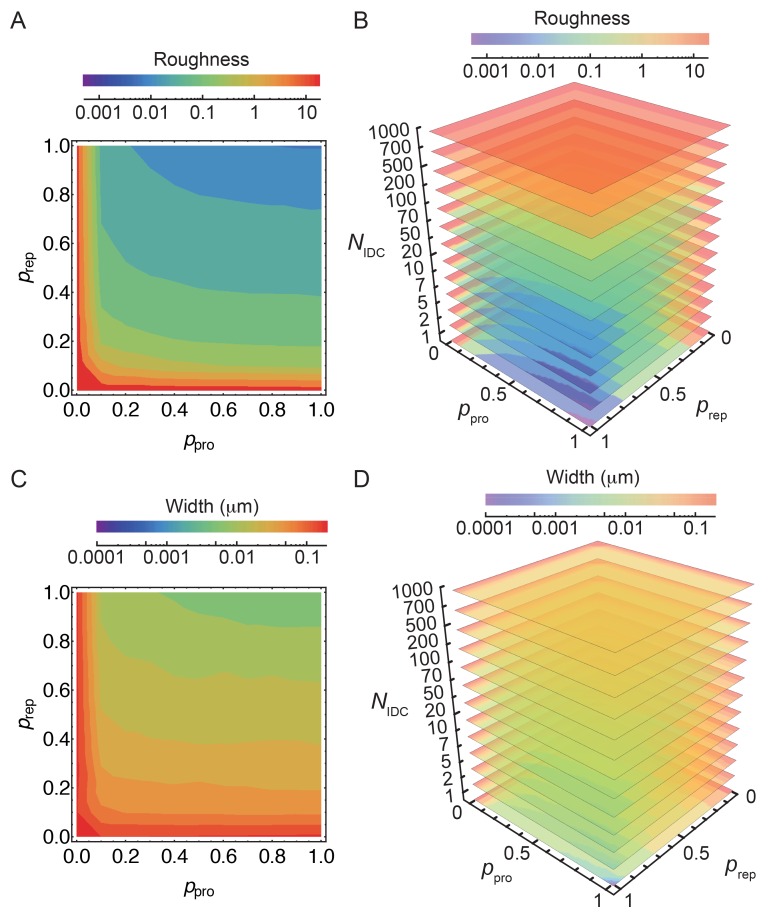
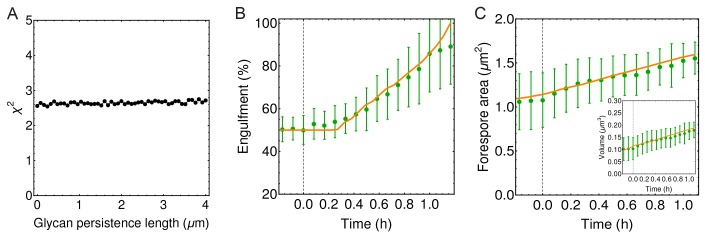
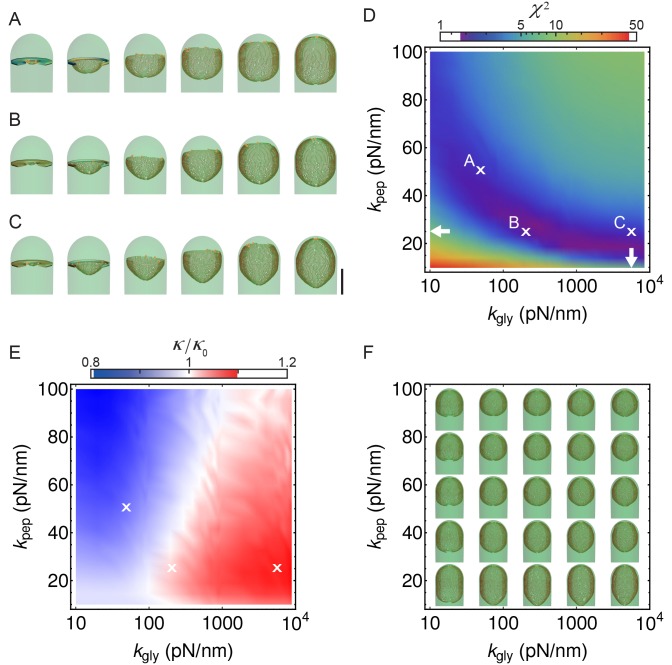
(A) Effective spring constants in our model represent coarse-grained PG network. Here the angle between neighboring stem peptides that belong to a single glycan is assumed to be 90°. Therefore, every other stem peptide is in plane with glycan sheet (Nguyen et al., 2015, Huang et al., 2008). The role of effective glycan persistence length on engulfment is negligible (see Figure 4—figure supplement 3). (B) Simulations for different values of effective peptide and glycan spring constants are compared with experimentally measured forespore surface area, volume and engulfment using mutual statistics (Equation 2). Arrows point to effective literature and (Nguyen et al., 2015). Dark blue region corresponds to simulation parameters that best fit experimental data (Figure 4—figure supplement 4, Video 3). For large enough 200 pN/nm mutual is almost independent of . (C) Snapshots of WT simulations for parameters ( = 200 pN/nm, = 25 pN/nm, = 5) marked with ’’ in panel (B) (Video 2). The thick septum is treated as outer cell wall, and is assumed degraded once IDCs move along. (D–E) Time traces of experimentally measured engulfment, forespore surface area and forespore volume (green) in comparison with results from a single simulation (orange). Parameters used in simulation are marked with ’’ in panel (B). For all other parameters see Appendix 2, Appendix-table 1. (F) Snapshots of fully engulfed forespores for various peptidoglycan elastic constants. (G) For various values of independent parameters and roughness of the LE is calculated at the end of stochastic simulations (see Figure 4—figure supplement 1, and Video 4). Here 0 roughness correspond to perfectly symmetric LE; for high enough 0.8 LE forms symmetric profiles. (H) Simulation for asymmetric engulfment is obtained for same parameter as WT except = 0.7 (marked with ’’ in panel (G)). Average ± SD. Scale bars 1 μm.

