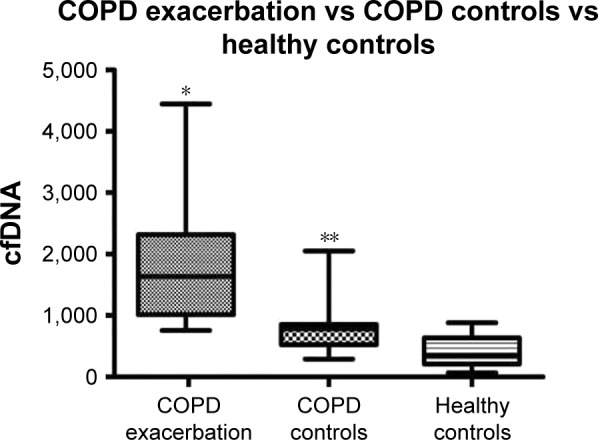
Figure 2.

Cell-free DNA (cfDNA) levels of COPD exacerbation group vs COPD stable control and healthy controls.
Notes: COPD exacerbation (n=62), 1,634 ng/mL (IQR 1,016–2,319) vs COPD controls (n=16), 781 ng/mL (IQR 523–855) vs Healthy controls (n=10), 352 ng/mL (IQR 209–636). *COPD exacerbation vs COPD controls and COPD exacerbation vs healthy controls, P<0.0001 for both comparisons; **COPD controls vs Healthy controls, P=0.014.
Abbreviation: IQR, interquartile range.
