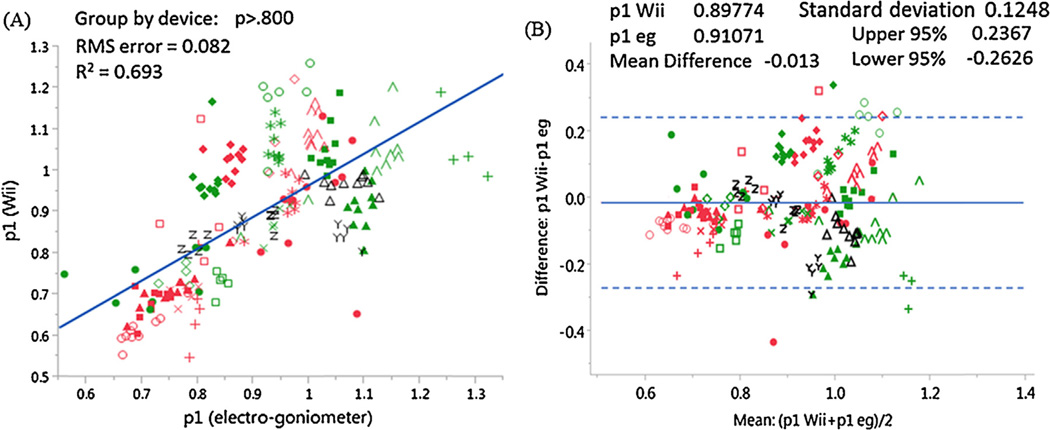
Fig. 2.
(A) Correlation coefficients and (B) Bland–Altman difference plots for the critical spasticity measure (normalized relaxation index) obtained from the Wii remote and the electrogoniometer. Different colored markers represent the varieties of groups and participants (red: affected side; green: nonaffected side; black: control). In general, the p1 value for nonaffected sides and controls is higher than for affected sides, and the intrinsic difference between the participants can be observed. (For interpretation of the references to color in this figure legend, the reader is referred to the web version of this article.)

