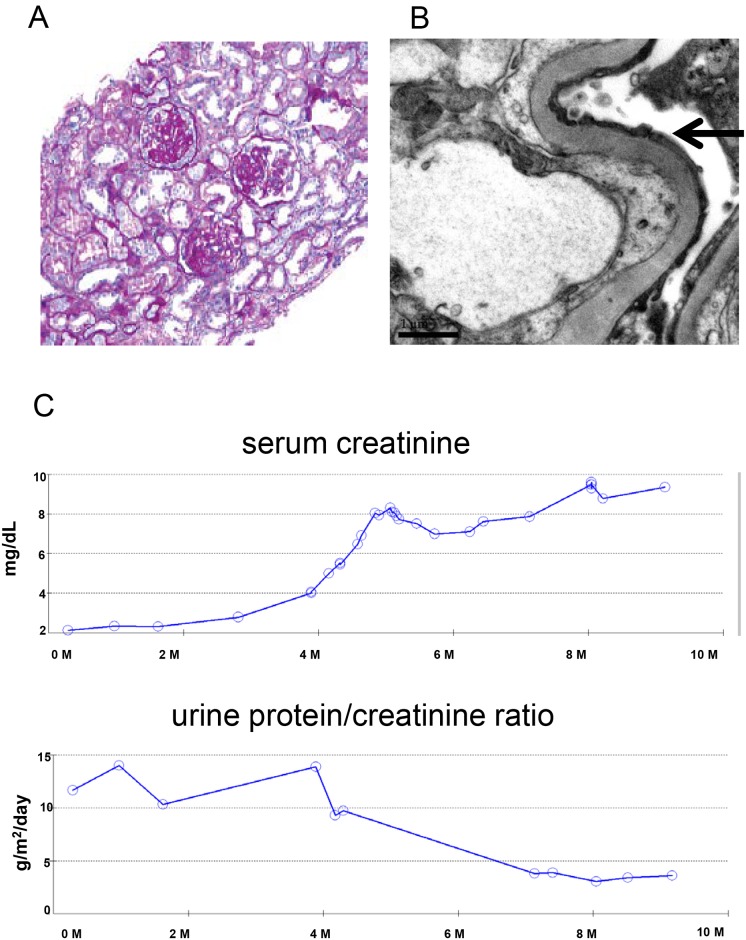
Fig 1.
(A), histologic findings in the patient’s kidney biopsy. Periodic acid–Schiff (PAS) staining (magnification 200X) shows segmental glomerulosclerosis and interstitial fibrosis with multiple foci of microcystic tubular dilation. (B), Electron microscopy images shows glomerular podocyte foot processes effacement (arrows) (magnification 20000X). (C), serum creatinine and urine protein/creatinine ratio of the patient over a period of a year.

